Content
Published:
This is an archived release.
Increased external trade in goods
Both exports and imports of goods increased in October compared to the same month a year ago. In total, exports of goods totalled NOK 83.6 billion. Mainland exports accounted for 44 per cent of the total export value. The trade surplus increased by 5.1 per cent and ended at NOK 31.6 billion.
| NOK Million | Change in per cent | NOK Million - so far this year | Change in per cent - so far this year | ||
|---|---|---|---|---|---|
| October 2014 | September 2014 - October 2014 | October 2013 - October 2014 | October 2014 | October 2013 - October 2014 | |
| 1The figures are marked with the symbol *. This is Statistics Norways standard symbol for indicating preliminary figures. | |||||
| 2Due to the data collection method, the preliminary monthly figures published for ships and oil platforms are often incomplete. In retrospect, therefore, the trade in these goods could in some cases lead to major corrections in the figures. Please see tables 2-4 for the impact these figures have on the external trade. | |||||
| Imports | 51 907 | 3.0 | 5.4 | 461 114 | 5.6 |
| Ships and oil platforms2 | 258 | -72.5 | -50.2 | 5 369 | -29.4 |
| Exports | 83 554 | 15.7 | 5.3 | 746 281 | 0.6 |
| Crude oil | 23 275 | -3.0 | 5.8 | 233 918 | 2.3 |
| Natural gas | 21 988 | 57.7 | -5.2 | 178 709 | -10.1 |
| Natural gas condensates | 1 133 | 50.1 | 52.2 | 7 050 | 1.7 |
| Ships and oil platforms2 | 120 | -73.5 | -77.7 | 6 029 | 20.0 |
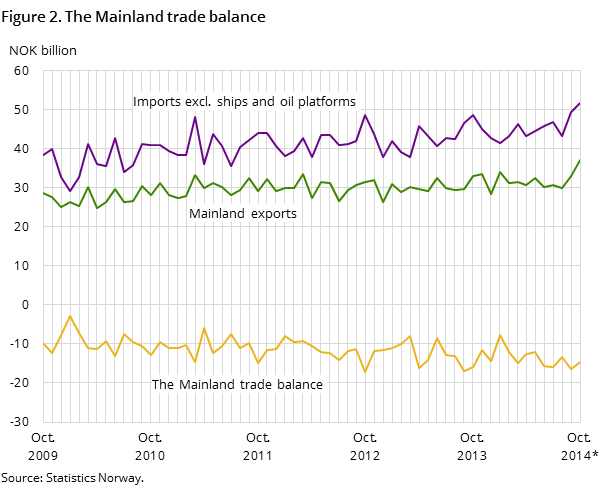
| Mainland exports | 37 038 | 12.1 | 12.7 | 320 575 | 5.9 |
| The trade balance | 31 647 | 45.3 | 5.1 | 285 167 | -6.6 |
| The mainland trade balance | -14 611 | 11.0 | 7.7 | -135 171 | -6.9 |
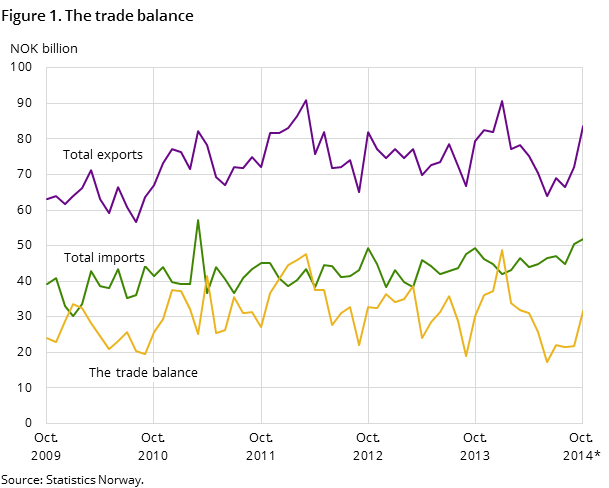
In October, imports of goods came to NOK 51.9 billion; NOK 2.7 billion more than in the same month last year. Imports of goods have not been higher since March 2011. There was an increase in imports for most of the main commodity groups of goods, and - as in September, there were large imports of machinery and raw materials to manufacturing and various projects.
Lower prices for oil and gas
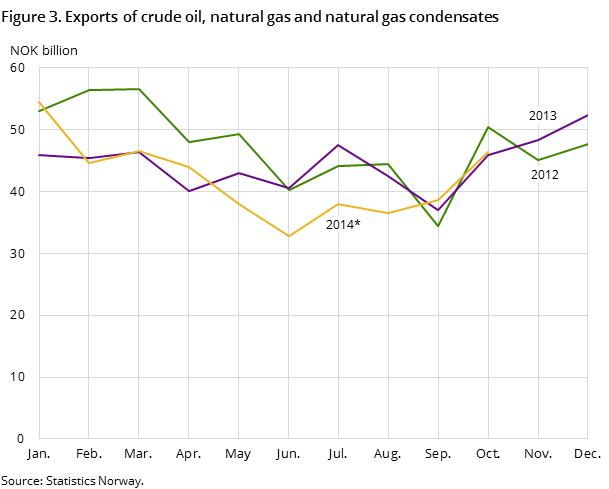
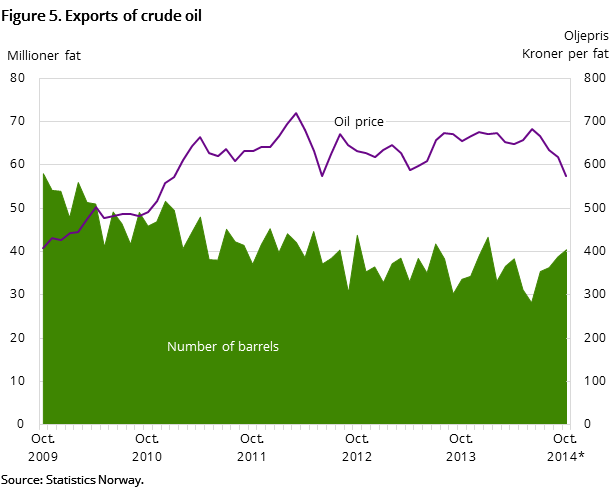
Crude oil exports totalled NOK 23.3 billion in October; an increase of 5.8 per cent compared to the same month in 2013. In total, exports amounted to 40.5 million barrels of crude oil compared to 33.6 million barrels the previous year. Higher export volumes offset the lower crude oil price, with an average price in October of NOK 575 per barrel compared to NOK 654 the same month last year.
Norway exported 9.8 billion cubic metres of natural gas in a gaseous state in October. This was 974 million standard cubic metres more than the year before. Despite the increased volume, lower prices pushed down the value, which totalled NOK 20.0 billion, down NOK 2.6 billion compared to October 2013.
Increased mainland exports
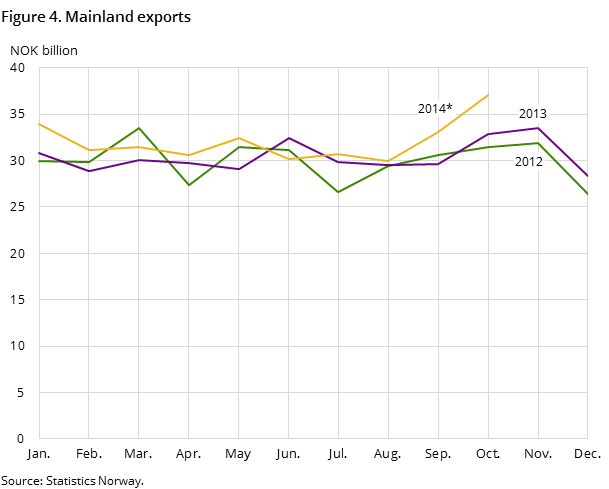
Mainland exports came to NOK 37.0 billion in October, compared to NOK 32.9 billion the same month last year; an increase of almost 13 per cent. There was an increase in exports for all the main commodity groups with the exception of the groups raw materials and fuels. Machinery and transport equipment rose by over NOK 2 billion and ended at NOK 8.8 billion. The largest increases were in the commodity groups electrical machinery as well as for industrial machinery.
In the main commodity group manufactured goods, exports increased for all metal products. In particular, the commodity group non-ferrous metals rose by NOK 664 million, totalling NOK 3.8 billion in October. Higher metal prices, both for aluminium and nickel accounted for much of the increase.
Large exports of mackerel and cod
Quotas for mackerel and cod rose for 2014, and fish exports rose by NOK 355 million in October, amounting to just over NOK 7.4 billion. Exports of mackerel totalled approx. NOK 1.6 billion; an increase of NOK 322 million from last October, and export values for cod rose to NOK 827 million in October compared to NOK 550 million a year earlier. Exports of whole, fresh and frozen salmon amounted to NOK 3.1 billion in October compared to NOK 3.3 billion last year. Both export volumes and prices were slightly lower this year.
Exports of electric current came to NOK 482 million in October, an increase of NOK194 million from the same month last year. On the other hand, exports of refined petroleum products fell by NOK 540 million to NOK 3.3 billion in October, compared to the corresponding month a year ago.
High imports of machinery and manufactured goods
Imports of machinery and transport equipment totalled NOK 19.5 billion in October, which is NOK 1.1 billion higher than last year. Within this main commodity group there was a particular growth in telecommunication apparatus. Imports in October rose by NOK 302 million, amounting to NOK 2.1 billion compared to the same month last year. Most of the rise came from increased imports of mobile telephones. In total, imports of phones amounted to NOK 230 million more than the year before; a total of 292 000 sets.
In the same main group, imports of other transport equipment increased by NOK 320 million, however, as this commodity group among others contains ships and aircrafts, values fluctuate between periods. There was an increase in imports in the main commodity group manufactured goods. Iron and steel saw a particular rise, by NOK 333 million from last year to NOK 1.6 billion in October. In the main commodity group crude materials there was an increase in imports for metalliferous ores and metal scrap.
Contact
-
Information services external trade
E-mail: utenrikshandel@ssb.no
-
Nina Rolsdorph
E-mail: nina.rolsdorph@ssb.no
tel.: (+47) 41 51 63 78
-
Jan Olav Rørhus
E-mail: jan.rorhus@ssb.no
tel.: (+47) 40 33 92 37
