Content
Published:
This is an archived release.
Historical high import
In April, imports of goods amounted to NOK 64.0 billion, while exports came to NOK 65.2 billion. The high import value is due to the import of an oil platform, which accounted for over a quarter of the value. Mainland exports increased slightly, while crude oil and gas exports declined.
| NOK Million | Change in per cent | NOK Million - so far this year | Change in per cent - so far this year | ||
|---|---|---|---|---|---|
| April 2015 | March 2015 - April 2015 | April 2014 - April 2015 | April 2015 | April 2014 - April 2015 | |
| 1The figures are marked with the symbol *. This is Statistics Norways standard symbol for indicating preliminary figures. | |||||
| 2Due to the data collection method, the preliminary monthly figures published for ships and oil platforms are often incomplete. In retrospect, therefore, the trade in these goods could in some cases lead to major corrections in the figures. Please see tables 2-4 for the impact these figures have on the external trade. | |||||
| 3The high percentage change for the period March 2015-April 2015 is correct. The change is due to the import of an oil platform in April. | |||||
| Imports | 64 009 | 13.4 | 45.3 | 211 035 | 19.6 |
| Ships and oil platforms23 | 17 313 | 693.4 | 2 480.2 | 20 545 | 1 418.5 |
| Exports | 65 175 | -17.1 | -13.5 | 283 635 | -13.2 |
| Crude oil | 17 392 | 5.6 | -33.2 | 61 921 | -40.7 |
| Natural gas | 14 955 | -38.0 | -12.2 | 83 533 | -4.3 |
| Natural gas condensates | 135 | -79.0 | -79.8 | 1 460 | -54.8 |
| Ships and oil platforms2 | 417 | 202.2 | -22.8 | 1 854 | -57.0 |
| Mainland exports | 32 277 | -13.3 | 3.8 | 134 866 | 5.7 |
| The trade balance | 1 167 | -94.7 | -96.3 | 72 600 | -51.7 |
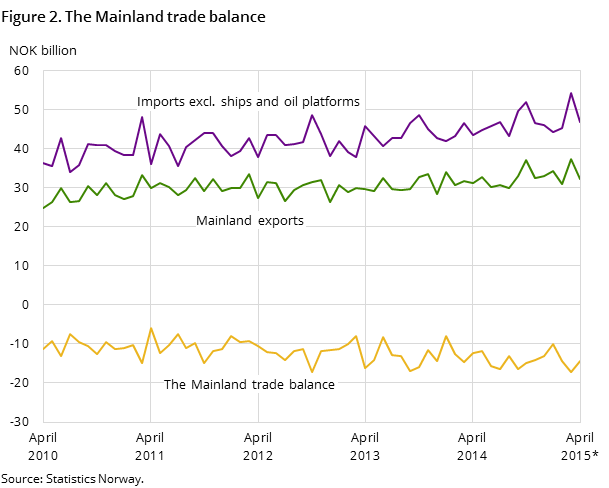
| The mainland trade balance | -14 419 | 15.4 | -17.3 | -55 623 | -17.0 |
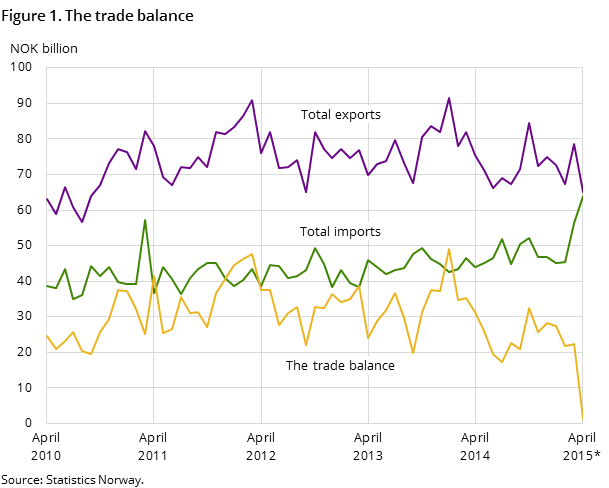
The trade balance in April was at an all-time record low – NOK 1.2 billion. When trade with ships and oil platforms is excluded, the trade surplus would be about NOK 18 billion.
Less oil and gas exports
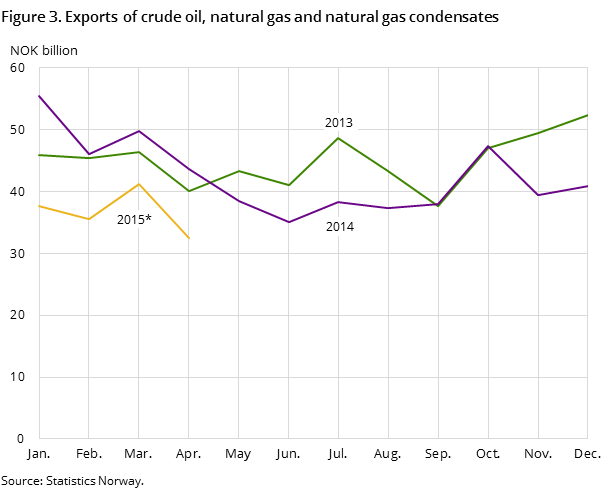
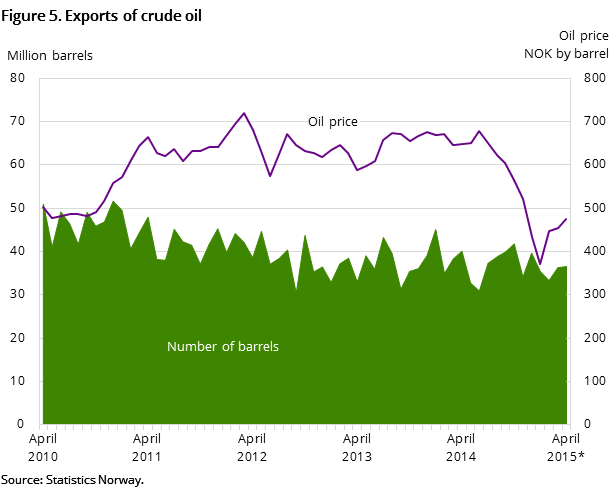
The export value of crude oil in April totalled NOK 17.4 billion, which is NOK 8.7 billion lower than the same month a year ago. The decline is due to both lower export volumes, 36.6 million compared to 40 million barrels last year, and lower prices – NOK 476 compared to NOK 649 per barrel.
The export value of natural gas in a gaseous state came to NOK 14.4 billion and was thus NOK 1.4 billion less than in April 2014. A total of 7.2 billion standard cubic metres of natural gas were exported in April, which is 1.2 billion fewer than in the same month last year. The low volume is partly caused by ongoing maintenance work.
Increased exports of industrial machinery, measuring equipment and metals
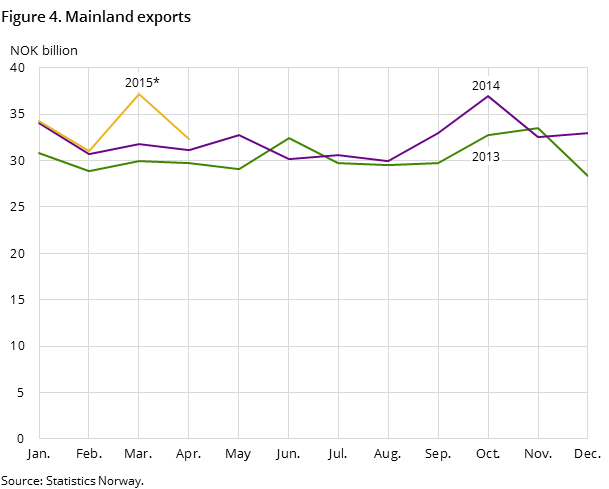
In April, mainland exports amounted to NOK 32.3 billion - an increase of 3.8 per cent compared with the same month a year back. In the main commodity group machinery and transport equipment, export of machinery specialised for particular industries came to NOK 1.9 billion; an increase of 77 per cent compared with the same month last year. A large part of this is machinery for use in the oil industry. Exports in the commodity groups general industrial machinery and electrical machinery also increased significantly – totalling NOK 1.8 and NOK 1.3 billion respectively.
In the main group miscellaneous manufactured articles, the subgroup professional, scientific and controlling instruments, which largely consists of various measuring instruments for ships and oil platforms, has shown a steady export increase. In April, exports of such instruments amounted to NOK 1.2 billion; NOK 0.25 billion more than in the same month last year.
As in the months earlier this year, there was a rise in exports for the commodity groups non-ferrous metals and manufactures of metals, both in the main group manufactured goods. For non-ferrous metals, the export value amounted to NOK 3.9 billion - NOK 578 million more than in April 2014. Approx. 30 per cent of the increase can be attributed to aluminium, which in spite of a lower exported volume profited from improved prices. Manufactures of metals also showed a marked rise in exports, from NOK 641 million to NOK 949 million compared to April the previous year.
Decline in fish and refined petroleum products
Exports of fish came to NOK 5.3 billion in April. The value was 5 per cent lower than in the same month in 2014. Both export volumes and prices rose for cod, however lower prices for salmon, which was around NOK 5 less per kilo, resulted in a decline of NOK 370 million in export values for whole fresh salmon compared to April last year.
In the main commodity group mineral fuels, export value for petroleum oils fell by NOK 438 million to NOK 3 billion compared to April 2014. The exported volume was higher and the decline was caused by lower prices.
Rise in imports of metalliferous ores and clothing
In April, imports of goods amounted to NOK 64 billion; about 45 per cent higher than in April 2014. Ships and oil platforms amounted to NOK 17.3 billion.
Imports of crude materials were largely unchanged compared to April last year. The exception was the commodity group metalliferous ores and scrap, which accounted for an import value of NOK 2.3 billion, which is NOK 0.5 billion more than in the same month last year. Metalliferous ores are largely used as inputs in metals industry.
Compared to April 2014, imports of cars rose by NOK 0.5 billion. In April, 16 210 cars were imported and around 13 per cent of these were electric vehicles. Clothing imports were just as high in April as in March 2015, with imports accounting for NOK 1.3 billion in both months. Compared to April 2014, imports of clothing rose by NOK 160 million.
Contact
-
Information services external trade
E-mail: utenrikshandel@ssb.no
-
Nina Rolsdorph
E-mail: nina.rolsdorph@ssb.no
tel.: (+47) 41 51 63 78
-
Jan Olav Rørhus
E-mail: jan.rorhus@ssb.no
tel.: (+47) 40 33 92 37
