Content
Published:
This is an archived release.
Decline in exports
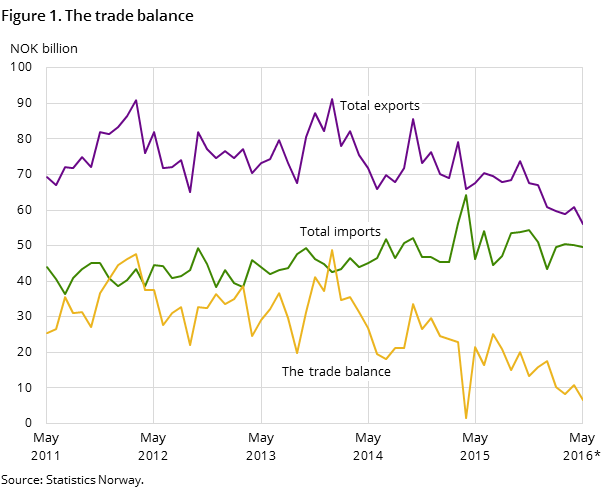
In May, exports of goods came to NOK 67.3 billion; a decline of 5.5 per cent compared to May 2014. This was due to lower oil prices and a drop in exports of petroleum products. Imports amounted to NOK 45.5 billion; an increase of 0.9 per cent.
| NOK Million | Change in per cent | NOK Million - so far this year | Change in per cent - so far this year | ||
|---|---|---|---|---|---|
| May 2015 | April 2015 - May 2015 | May 2014 - May 2015 | May 2015 | May 2014 - May 2015 | |
| 1The figures are marked with the symbol *. This is Statistics Norways standard symbol for indicating preliminary figures. | |||||
| 2Due to the data collection method, the preliminary monthly figures published for ships and oil platforms are often incomplete. In retrospect, therefore, the trade in these goods could in some cases lead to major corrections in the figures. Please see tables 2-4 for the impact these figures have on the external trade. | |||||
| Imports | 45 505 | -29.0 | 0.9 | 256 562 | 15.8 |
| Ships and oil platforms2 | 185 | -98.9 | -47.7 | 20 735 | 1 114.0 |
| Exports | 67 276 | 2.8 | -5.5 | 354 079 | -11.1 |
| Crude oil | 17 941 | 3.2 | -15.9 | 82 150 | -34.7 |
| Natural gas | 16 090 | 7.6 | -3.5 | 99 623 | -4.2 |
| Natural gas condensates | 1 164 | 760.2 | 193.5 | 2 624 | -27.6 |
| Ships and oil platforms2 | 30 | -96.8 | . | 2 626 | -39.1 |
| Mainland exports | 32 051 | 0.1 | -2.3 | 167 055 | 4.2 |
| The trade balance | 21 771 | 1 474.2 | -16.7 | 97 517 | -44.8 |
| The mainland trade balance | -13 269 | 9.9 | -11.2 | -68 772 | -15.7 |


Overall, the trade surplus in May ended at NOK 21.8 billion, down 16.7 per cent from May 2014.
Lower income from oil exports
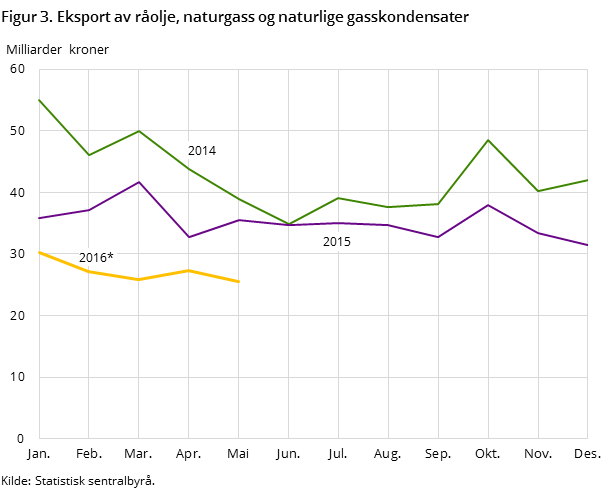
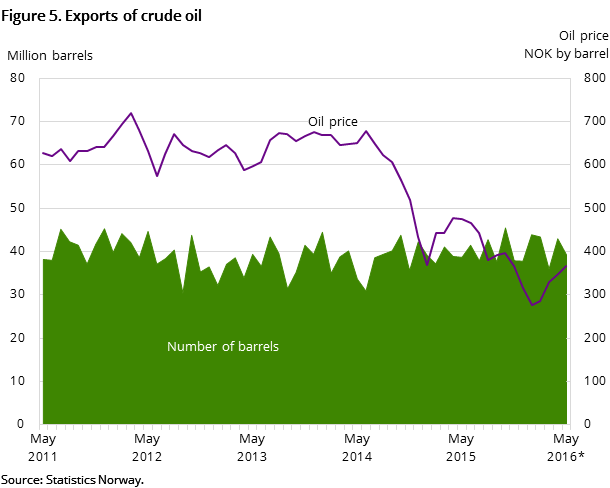
The export value of crude oil totalled NOK 18 billion in May, down 15.9 per cent compared to May last year. The decrease was mainly due to lower oil prices. Average price per barrel was NOK 489; an increase from April last month, but down 25.0 per cent compared to May 2014. A total of 36.7 million barrels were exported, which was the same level as last year. Natural gas exports also dropped, and went down by 3.5 per cent, ending at NOK 16.1 billion.
Drop in exports of petroleum products
Mainland exports reached NOK 32.1 billion and were 2.3 per cent lower than in May 2014. The largest decline was in exports of petroleum products, which went down 41.9 per cent, ending at NOK 3.3 billion. A large decline was also seen in exports of liquefied butane and propane, which totalled NOK 1.2 billion, down 21.1 per cent.
In the main commodity group machines and transport equipment, exports increased. Particularly in the commodity group other machineries and electric machines, which went up by 35.0 and 27.6 per cent – totalling NOK 2.3 and NOK 1.4 billion respectively. Exports in the main commodity group chemical products also increased, up by 19.7 percent – ending at NOK 4.1 billion.
Increase in cod exports
Cod pushed up the total export of fish in May and higher prices contributed. Clip fish of Atlantic cod more than doubled and totalled NOK 238 million, while exports of salted cod increased by 57.4 per cent and reached NOK 152 million. Exports of fresh whole cod also went up, while frozen cod went somewhat down.
High imports of diesel and metalliferous ores
Overall, total imports reached NOK 45.5 billion in May, and were 0.9 per cent higher than May last year. A large increase was seen in imports of petroleum and petroleum products, which went up 29.0 per cent and amounted to NOK 2.8 billion. Imports of diesel made a particular contribution. Imports of metalliferous ores and metal scrap increased by 24.9 per cent and totalled NOK 2 billion.
In the other direction, imports of goods of metals declined by 29.6 per cent – totalling NOK 2.2 billion. This was due to high imports in May 2014, when oil platform constructions contributed.
Contact
-
Information services external trade
E-mail: utenrikshandel@ssb.no
-
Nina Rolsdorph
E-mail: nina.rolsdorph@ssb.no
tel.: (+47) 41 51 63 78
-
Jan Olav Rørhus
E-mail: jan.rorhus@ssb.no
tel.: (+47) 40 33 92 37
