Content
Published:
This is an archived release.
Weakened mainland exports
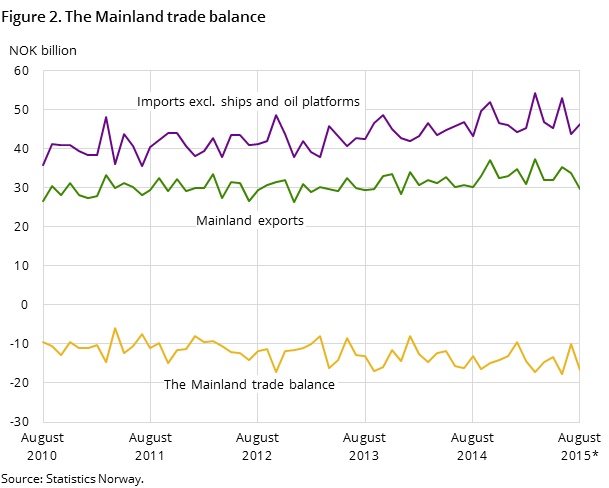
Exports of goods amounted to NOK 67.8 billion in August; approximately the same level as last year. A drop in the export of refined petroleum products led to a decline in mainland exports. Imports came to NOK 46.9 billion; an increase of 4.6 per cent compared to August 2014.
| NOK Million | Change in per cent | NOK Million - so far this year | Change in per cent - so far this year | ||
|---|---|---|---|---|---|
| August 2015 | July 2015 - August 2015 | August 2014 - August 2015 | August 2015 | August 2014 - August 2015 | |
| 1The figures are marked with the symbol *. This is Statistics Norways standard symbol for indicating preliminary figures. | |||||
| 2Due to the data collection method, the preliminary monthly figures published for ships and oil platforms are often incomplete. In retrospect, therefore, the trade in these goods could in some cases lead to major corrections in the figures. Please see tables 2-4 for the impact these figures have on the external trade. | |||||
| Imports | 46 944 | 5.1 | 4.6 | 403 306 | 10.6 |
| Ships and oil platforms2 | 579 | -34.5 | -65.1 | 24 288 | 174.7 |
| Exports | 67 772 | -0.8 | 0.6 | 560 442 | -6.7 |
| Crude oil | 15 720 | 2.8 | -34.9 | 132 131 | -32.3 |
| Natural gas | 18 219 | -1.2 | 42.5 | 151 745 | 5.7 |
| Natural gas condensates | 668 | 357.2 | 83.5 | 3 871 | -25.0 |
| Ships and oil platforms2 | 3 537 | 383.2 | 17 585.0 | 7 045 | 29.1 |
| Mainland exports | 29 627 | -12.0 | -1.4 | 265 650 | 5.7 |
| The trade balance | 20 828 | -11.8 | -7.3 | 157 136 | -33.4 |
| The mainland trade balance | -16 738 | -65.6 | -27.1 | -113 367 | -8.4 |
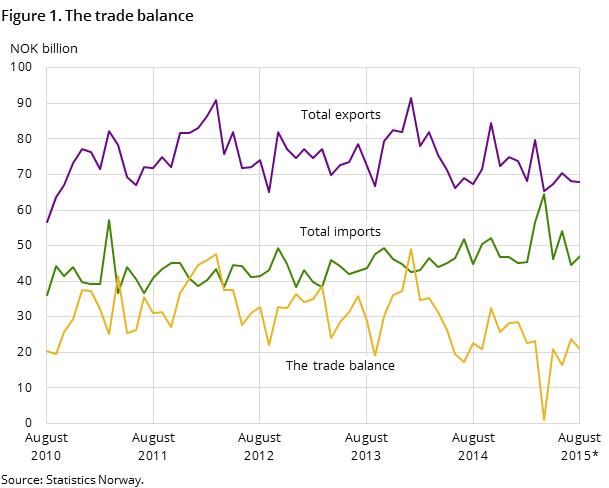
Exports of one oil rig pulled up export figures for August. The trade surplus totalled NOK 20.8 billion and ended at 7.3 per cent lower than in August 2014.
Crude oil down - natural gas up
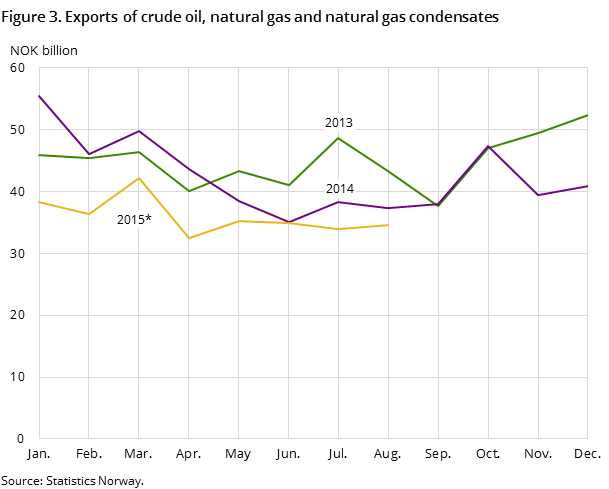
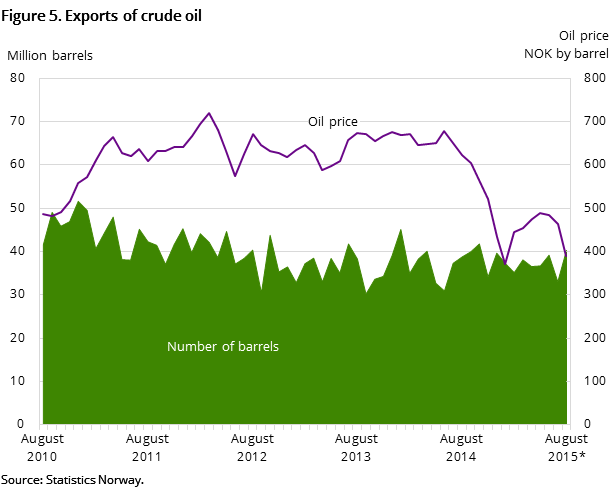
Crude oil exports came to NOK 15.7 billion in August; a fall of NOK 8.4 billion compared to the same month last year. The volume was larger, and the decline in exports was due to low oil prices. The average price per barrel of crude oil was NOK 390 in August compared to NOK 623 the year before. The total exported volume of crude oil in August was 40.3 million barrels compared to 38.8 million a year ago.The export value of natural gas in a gaseous state came to NOK 18.2 billion, roughly 42 percent more than in August last year. The export volume was also larger. A total of 8.9 billion standard cubic meters of natural gas were exported in August compared to 6.7 billion cubic meters last year.
Drop in export of refined petroleum products
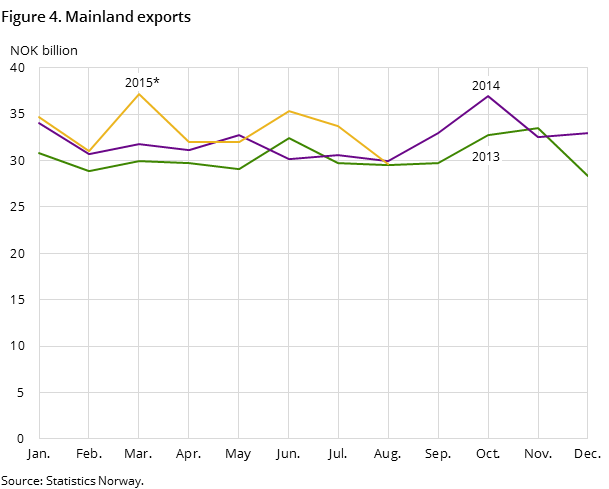
Mainland exports ended at NOK 29.6 billion; 1.4 per cent less than in August 2014. This is the first time since 2013 the figure has been below NOK 30 billion.
The decline was mainly due to lower exports of refined petroleum products. The exports fell by NOK 1.2 billion, amounting to NOK 2.5 billion compared to the same month last year. A larger decline was also seen for exports of liquefied butane and propane, ending at NOK 750 million; a drop from NOK 1.6 billion in August last year. Lower results, for both product groups, were due to a reduction in export volumes as well as a substantial fall in prices.
Continued increase in fish exports
Exports of fish came to NOK 5.2 billion in August, compared to NOK 4.6 billion a year ago. Whole fresh salmon accounted for 56 per cent of the total fish exports in August. The growth was mainly from a higher price for fresh whole salmon, on average over NOK 43 per kg in August, which is NOK 7 more than in the same period last year.
Increased exports of chemical products and timber
Exports of chemical products amounted to NOK 4.1 billion and were thus 13 per cent higher than in August 2014. In the main commodity group crude materials, exports of timber rose by 60 per cent to about NOK 300 million, while exports of metalliferous ores and metal scrap - within the same main group - fell by about NOK 150 million to nearly NOK 270 million.
Import increase for clothes and footwear
Imports of goods in August went up by just over NOK 2 billion and came to around NOK 47 billion.
There was an increase within most commodity groups under the main group chemical products. Total imports of chemical products amounted to NOK 5.4 billion – NOK 1.1 billion more than in August last year.
Imports of clothing and footwear rose by around 20 and 25 per cent respectively compared to August a year ago. In total, imports of clothing and footwear amounted to NOK 2.9 billion, which is NOK 0.5 billion higher than in the same month a year ago. The rise was primarily price-related, but a bigger volume was also imported, especially for footwear. In total, 2.6 million pairs of shoes were imported - 300 000 more than in August 2014. Imports of cars were slightly higher than the same month a year ago, however around 14 per cent of the passenger cars imported in August were electric cars.
Decline in imports of iron and steel and metalliferous ores
Within the main group manufactured goods, imports of iron and steel continued to drop, amounting to NOK 1.1 billion - about NOK 600 million less than in August last year. Under the main group raw materials, imports of metalliferous ores and metal scrap fell by 24 per cent to NOK 1.1 billion in August. There was also a lower import value for the commodity group other transport equipment. This is due to the contents of this group; containing among other things high value vehicles such as ships and aircrafts etc.
Contact
-
Information services external trade
E-mail: utenrikshandel@ssb.no
-
Nina Rolsdorph
E-mail: nina.rolsdorph@ssb.no
tel.: (+47) 41 51 63 78
-
Jan Olav Rørhus
E-mail: jan.rorhus@ssb.no
tel.: (+47) 40 33 92 37
