Content
Published:
This is an archived release.
Further fall in exports
In January, export of goods amounted to NOK 60.4 billion - 18.7 per cent less than the corresponding month the previous year. Lower oil and natural gas prices are the main reason for the decline, but mainland exports also contributed to the decline. Imports amounted to NOK 43.5 billion.
| NOK Million | Change in per cent | ||
|---|---|---|---|
| January 2016 | December 2015 - January 2016 | January 2015 - January 2016 | |
| 1The figures are marked with the symbol *. This is Statistics Norways standard symbol for indicating preliminary figures. | |||
| 2Due to the data collection method, the preliminary monthly figures published for ships and oil platforms are often incomplete. In retrospect, therefore, the trade in these goods could in some cases lead to major corrections in the figures. Please see tables 2-4 for the impact these figures have on the external trade. | |||
| Imports | 43 493 | -14.6 | -4.2 |
| Imports of ships and oil platforms2 | 312 | 169.0 | -70.3 |
| Exports | 60 354 | -12.6 | -18.7 |
| Crude oil | 11 369 | -14.3 | -21.8 |
| Natural gas | 17 835 | -10.1 | -26.0 |
| Natural gas condensates | 561 | 395.6 | 50.4 |
| Ships and oil platforms2 | 14 | -98.1 | -98.1 |
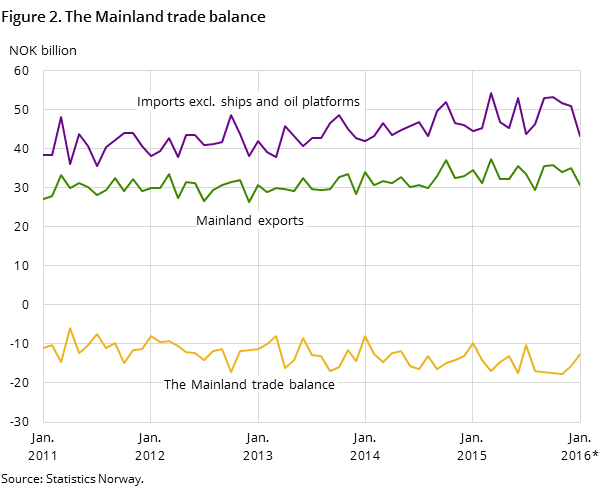
| Mainland exports | 30 575 | -12.9 | -11.4 |
| The trade balance | 16 861 | -6.9 | -41.6 |
| The mainland trade balance | -12 606 | -19.9 | 28.2 |
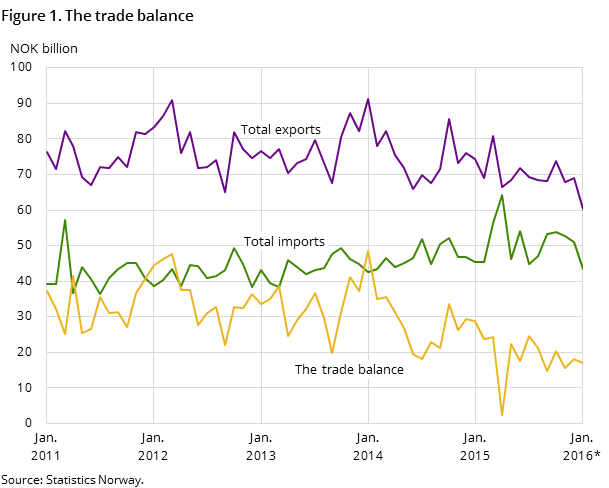
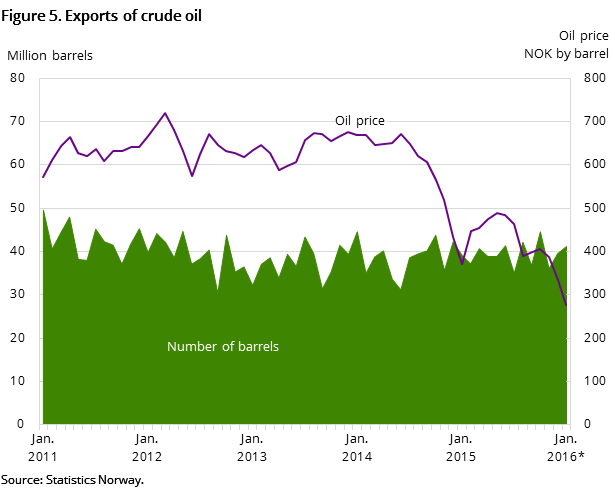
Exports in January came to NOK 60.4 billion; the lowest level since August 2010. From December 2015, exports decreased by 12.6 per cent, while the decline compared with January last year is a substantial 18.7 per cent. Imports also declined, and were down 4.2 per cent from January last year, constituting NOK 43.5 billion.
In total, this resulted in a reduction in the trade surplus of 41.6 per cent in January 2016, which came to NOK 16.9 billion.
Lowest oil exports for 16 years
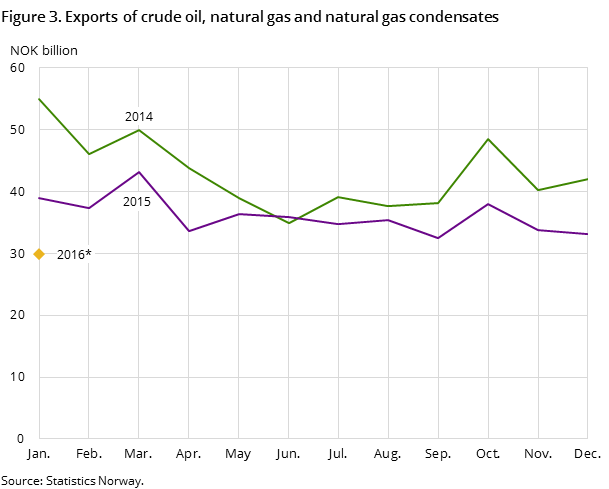
The value of oil exports amounted to NOK 11.4 billion in the first month of 2016, which is the lowest recorded level since June 1999, when exports amounted to NOK 9.8 billion. Despite an increase in the export volume compared with January 2015, the value of exports decreased by 21.8 per cent due to lower prices. Prices fell by 25.6 per cent from January last year, and ended at NOK 276 a barrel. A total of 41.2 million barrels of crude oil were shipped abroad in January compared to 39.2 million barrels in the corresponding month last year - an increase of 5.1 per cent.
Exports of natural gas ended at NOK 17.8 billion in January, down NOK 6.3 billion or 26.0 per cent from January 2015. Once again, it was lower prices that caused the decline. Exports of natural gas in a gaseous state totalled 10.6 billion cubic metres, up 8.7 per cent from January 2015.
Decline in mainland exports
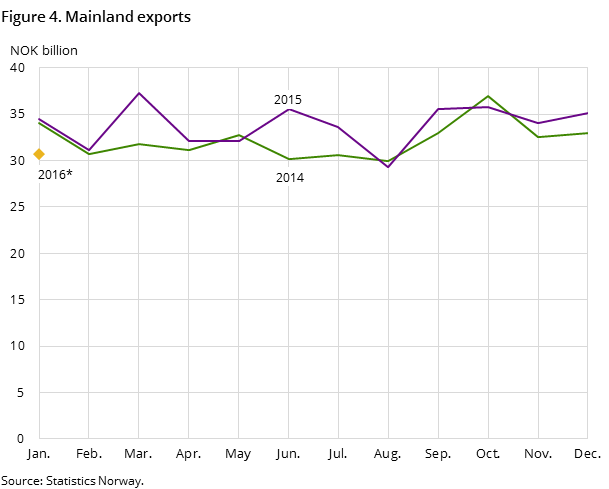
Exports of mainland goods amounted to NOK 30.6 billion in January 2016. This is a decrease of 11.4 per cent compared with January last year. The largest reduction was within the main commodity Group machinery and transport equipment, which fell by 35.5 per cent to NOK 6.4 billion. The decline is especially evident since exports within this commodity group in January 2015 were particularly high. Exports of refined petroleum products fell 34.2 per cent to NOK 2.1 billion due to reductions in price and volume.
Otherwise, exports of manufactured goods went down 15.0 per cent and amounted to NOK 5.6 billion. The sub-group metals, ferrous metals fell the most from January 2015, by NOK 685 million to NOK 3.2 billion. Lower aluminium prices were a strong contributing factor to this. The sub-groups iron and steel and manufactures of metals also fell, by NOK 199 million and NOK 126 million respectively, amounting to NOK 982 and NOK 658 million.
The export value of fish increased from NOK 5.5 billion in January 2015 to NOK 6.6 billion, which represents a growth of 19.3 per cent. The increase is largely due to high salmon prices. In January, the average price for fresh whole salmon of NOK 55 per kilo is more than NOK 10 higher than in the corresponding period last year. The export value of fresh whole salmon accounted for more than 60 per cent of Norwegian fish exports in January.
Reduced value of imports
Imports declined by 4.2 per cent from January 2015, and amounted to NOK 43.5 billion in the first month of 2016.
The greatest decline was in the main commodity group non-edible crude materials, which went down by 26.6 per cent to NOK 2.6 billion. The sub-group metalliferous ores and metal scrap, with a reduction in import value of NOK 918 million, accounted for almost all of this. The main commodity group machinery and transport equipment also declined, due to a reduction in several of the hardware sub-groups. Meanwhile, the import value of passenger cars rose and pulled in the opposite direction.
Otherwise, imports of mineral fuels also went down compared to 2015. Here the value of imports decreased by 34.2 per cent to NOK 1.5 billion. The sub-group refined mineral oils saw the largest decrease, down 39 per cent to NOK 1.1 billion.
The largest increase was in the main commodity group miscellaneous manufactured articles. Overall, this group went up 4.8 per cent from January last year to NOK 7.9 billion. Despite growth in the volume of imports, the sub-group clothing contributed most, increasing NOK 113 million to NOK 1.8 billion due to more expensive clothing as a result of the depreciation of the Norwegian krone.
Contact
-
Information services external trade
E-mail: utenrikshandel@ssb.no
-
Nina Rolsdorph
E-mail: nina.rolsdorph@ssb.no
tel.: (+47) 41 51 63 78
-
Jan Olav Rørhus
E-mail: jan.rorhus@ssb.no
tel.: (+47) 40 33 92 37
