Content
Published:
Record high imports in 2011
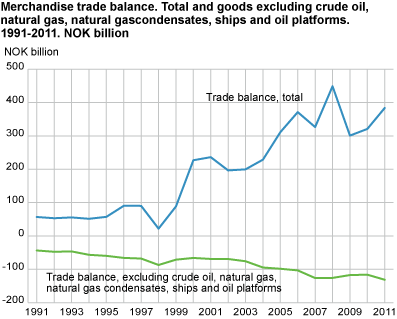
The Norwegian external trade in 2011 grew compared to 2010. Both imports and exports rose, and imports reached a record high. Exports were approaching the record year of 2008 as was the trade balance.
The total export value of 2011 reached NOK 892.7 billion, while the import of commodities amounted to NOK 509.0 billion. Consequently, the trade surplus came to NOK 383.7 billion. This was 20 per cent higher than in 2010 and 28 per cent higher than in 2009, but still 15 per cent lower than in 2008.
In 2011, exports accounted for 33 per cent of the gross national product. The share was 31 per cent in 2009 and 37 per cent the previous year. The corresponding figures for the imports were 19 per cent in 2011 and 20 per cent in 2008.
The exports increased by NOK 104.6 billion, representing a rise of 13.3 per cent compared to 2010. Growing oil and gas revenues accounted for close to NOK 77 billion of the rise. Mainland exports showed an increase for most main commodity groups, and for manufactured goods, inedible crude materials as well as chemicals in particular. However, the export of machinery and transport equipment pulled in the opposite direction.
Imports rose by NOK 41.7 billion, or 8.9 per cent, compared to 2010. The growth was visible in all commodity groups. In particular vehicles, metalliferous ores and machinery for special industries had a large upturn. The import of machinery, however, had not yet recovered from the financial crisis.
Record high crude oil price
Compared to 2010, the average oil price rose by NOK 140 per barrel, ending at NOK 627 per barrel in 2010. This led to a 14 per cent increase in export values of crude oil, making the total value NOK 321.1 billion. The number of barrels exported has fallen continuously since the export peak of 2001. Exported volumes in 2011 amounted to 512 million barrels of crude oil, down 11 per cent from the previous year, and nearly half of the volume in 2001.
Export value for natural gas up
In 2011, total natural gas exports came to NOK 190 billion, up 23 per cent compared to 2010, yet 10 per cent less than in the record year of 2008. The result was caused by fluctuations in the price of natural gas. The price was on average NOK 2.00 per cubic metre for 2011, compared to NOK 1.59 the year before. A total of 94.9 billion Sm 3 (standard cubic metres) natural gas in gaseous state was exported in 2011. This constituted a decrease of 2.5 billion Sm 3 , or 2.5 per cent, compared to 2010. The largest recipient countries by value in 2011 were United Kingdom, Germany and France.
Metal exports grew while engineering products fell
The metal exports rose again this year, following the drop in 2009. It amounted to NOK 71 billion, which is equal to a 4.5 per cent rise. However, this is still lower than the export value of the years 2006-2008. The increase was mainly due to higher prices. Alloys of aluminium; the most important product, increased by NOK 1.1 billion and amounted to NOK 21.5 billion. This was followed by unalloyed nickel, which went up close to 3 per cent, to NOK 12.2 billion.
In 2011, the export of engineering products came to NOK 69.9 billion, which is a decline compared to 2009 and 2010 of 14.8 and 6.5 per cent respectively. Parts of drilling machines were the single product with the highest export value; NOK 3.8 billion in 2011. However, this commodity and several others experienced a fall in export value.
Steady fish exportsThe export of fish has stabilised at a high level in recent years. In 2011, the export amounted to NOK 52.1 billion compared to NOK 52.5 billion the year before and NOK 43.5 billion in 2009. We exported the most fish to Russia and France in 2011, which amounts to 20 per cent of the market alone.
Our most important export product was fresh fish-farmed salmon, which accounted for 42 per cent of the total export of fish last year. This was followed by frozen mackerel, which rose by more than NOK 550 million.
Export businesses in growth
The mining and extraction industry, in which the exports of crude oil and natural gas dominate completely, accounted for 59 per cent of the total export value. The export from this activity came to NOK 531.8 billion; an increase of 18 per cent compared to 2010.
Exports from the manufacturing industries stood for 36 per cent of the total export. The increase was NOK 24.3 billion, or 8 per cent, compared to 2010. Refineries and basic metals have alternated places as the most important activity in the manufacturing industry in recent years. In 2011, refineries came first.
Machinery and metal businesses import more
In 2011, NOK 470 billion, or 92 per cent, of the total import came from the manufacturing industries. There was a general increase in value of 9 per cent from 2010, and close to all activities showed growth.
Like previous years, machinery and equipment was the largest activity in 2011 amounting to NOK 52.5 billion, up 14 per cent from 2010. Metals came second with an import value of NOK 48.4 billion, in comparison a rise of 20 per cent in the same period.
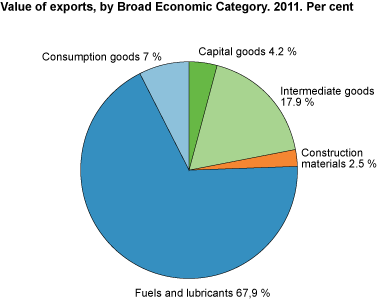
In 2011, exports of fuels and lubricants increased the most by broad economic categories. Revenues from oil and gas exports contributed to the result.
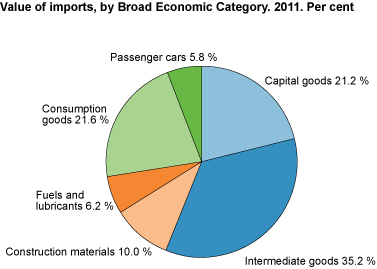
Imports of passenger motor cars had the largest percentual growth. The import value came to NOK 29.4 billion - 13 higher than in 2010. Counted in numbers, the import reached 194 500 cars, which is an increase of 6 per cent.
Falling exports to Asia
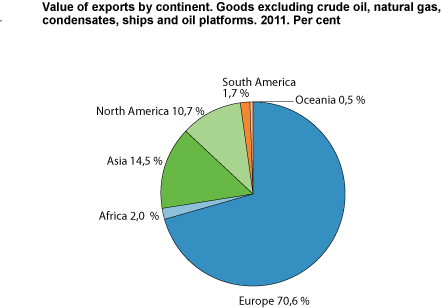
A geographical distribution of the Norwegian mainland export in 2011 showed a decrease to some continents, and Asian countries reduced the most. When excluding crude oil, natural gas, condensates, ships and oil platforms, the total export value increased by NOK 26.8 billion or 8 per cent compared to 2010.
Exports to European countries accounted for 70 per cent of the total mainland exports in 2011, with a value of NOK 254.4 billion, compared with NOK 223.3 billion in 2010. Like the previous year, the main recipient countries were Sweden and Germany in 2011, with Norwegian exports worth NOK 40.5 billion and NOK 31.1 billion. When including the export of continental shelf commodities, the United Kingdom was the most important recipient of exports, as the British received Norwegian crude oil at an export value of NOK 163.8 billion in 2011.
Asia has been receiving an increasing amount of the mainland exports. Nevertheless, in 2011, Asian countries received 14.5 per cent of exports excluding crude oil, natural gas, condensates, ships and oil platforms, compared with 17.3 per cent in 2010. However, exports to China developed in a positive direction in the corresponding period. The main goods exported to China were fish, chemicals and non-ferrous metals, all with a value of over NOK 2 billion.
Mainland exports to North and Central America increased by 10.7 per cent compared with 2010. The dominating market, the USA, received goods worth NOK 30.4 billion in 2011. From 2010 to 2011, exports of fish and chemicals in particular, as well as professional and scientific instruments increased.
More imports from all parts of the world
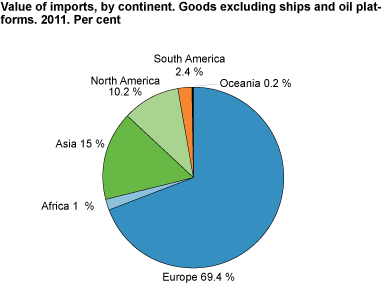
The import from all parts of the world rose in 2011 compared to 2010. Excluding ships and oil platforms, imports from European countries came to NOK 341.2 billion; an increase of 7.3 per cent. Imports from Asian countries also increased noticeably in 2011, and were 12 per cent up from 2010. Imports from North and Central America amounted to NOK 50.2 billion; an increase of 17.3 per cent.
Sweden was our largest trading partner, also with respect to imports, with a value of NOK 68.2 billion in 2011. This was more than in 2010, and closer to the level before the financial crisis. The main commodities coming from Sweden were petroleum products and cars.
After Sweden, we imported most commodities from Germany in 2011. These imports increased by 6.3 per cent from 2010, with road vehicles having the largest increase. Like the previous year, China was the third largest shipper of commodities to Norway in 2011, with an increase of 14.9 per cent. Our Chinese imports are growing faster than from the other countries.
Developing countries generate more trade
Imports from developing countries came to NOK 87.8 billion in 2011. This was NOK 10.5 billion or 13.5 per cent up from 2010. Imports from these countries increased greatly up to 2008, before decreasing in 2009. An improvement of the general financial situation has again led to increasing exports from these countries to Norway.
Imports from countries with preferential treatment (according to the GSP agreement, see appendix for more information ) went up NOK 9.9 billion to NOK 81.7 billion in 2011. Of total imports, the share of dutiable imports affected by GSP reached NOK 14 billion, of which NOK 9.1 billion was eligible for GSP treatment. However, only NOK 7.5 billion was agreed as GSP treatment.
Imports from the least developed countries (LDC) increased slightly by NOK 119 million, to NOK 5.2 billion in 2011.
Tables in StatBank changed 28 June
The tables in StatBank were changed on 28 June. The number of monthly tables has increased from 3 to 9, and the number of yearly tables from 4 to 13. There is now only one quarterly table, since the two mode of transport tables have been aggregated into one table. The increased number of tables in the StatBank implies that there are several new opportunities to find figures at an aggregated level. All the monthly tables except those for 8-digit commodity numbers have been given a new variable - “So far this year”. Additionally, the monthly and yearly tables for the SITC have been expanded with a 3-digit level. The tables showing the main figures have been expanded from monthly figures and will now also include yearly figures and figures by country and trade area. Seasonally-adjusted figures are now in a separate table. The new tables in StatBank also include figures from other nomenclatures, by groups of end use (BEC) and by industry (CPA). Mainland exports by county of production and trade in ICT goods have also been included, in addition to some special tables for exports of fish, crude oil and natural gas. Most of the tables have figures from 1988, but some have a shorter time series and some of the main figures have longer series. |
Tables
Charts
Main figures. 1991-2011
1. External merchandise trade. Imports and exports, total. 1991-2011. NOK billion
External trade with goods by Value, price and volume indices. 1996-2011
External trade with goods by Broad Economic Category. 2011
7. Value of imports by Broad Economic Category. 2011. Per cent
8. Value of export by Broad Economic Category. 2011. Per cent
External trade with goods by trade area. 2011
9. Value of imports by trade area. 2011. Per cent
10. Value of exports by trade area. 2011. Per cent
External trade with goods by continent. 2011
11. Value of imports by continent. Goods excluding ships and oil platforms. 2011. Per cent
The statistics is published with External trade in goods.
Contact
-
Statistics Norway's Information Centre
E-mail: informasjon@ssb.no
tel.: (+47) 21 09 46 42

