Content
Published:
This is an archived release.
Decrease in external trade in services
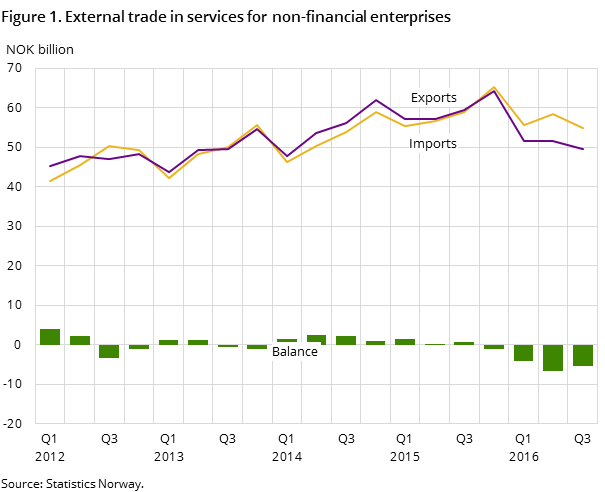
Imports and exports of services decreased from the 2nd quarter of 2016 to the 3rd quarter of 2016. Imports ended at NOK 54.9 billion, while exports of services amounted to NOK 49.6 billion.
| 3rd quarter 2016 | Change in per cent | ||
|---|---|---|---|
| 2nd quarter 2016 - 3rd quarter 2016 | 3rd quarter 2015 - 3rd quarter 2016 | ||
| Exports | 49 593 | -4.1 | -16.7 |
| Imports | 54 946 | -5.8 | -6.7 |


Non-financial enterprises, including the shipping industry, exported services for NOK 49.6 billion in the 3rd quarter of 2016: down by NOK 2 billion from the previous quarter. Compared with the 3rd quarter of 2015, the export of services decreased by NOK 9.9 billion, or 16.7 per cent in the 3rd quarter of 2016.
The import of services amounted to NOK 54.9 billion in the 3rd quarter of 2016: down by 5.8 per cent or NOK 3.4 billion from the previous quarter. Compared with the 3rd quarter of 2015, the import of services decreased by NOK 3.9 billion in the 3rd quarter of 2016.
Export of sea and coastal water transport services still decreasing
Although sea and coastal water transport services experienced a decrease, they continue to be Norway’s largest export of services. These services accounted for 33.1 per cent of the total service export in the 3rd quarter of 2016, and amounted to almost NOK 16.4 billion. Business services ended at NOK 9.2 billion, up 10 per cent from the 2nd quarter of 2016. In terms of value, these services went up by about NOK 834 million from the 2nd quarter.
Looking at Norway’s service import, business services is the largest group in the 3rd quarter, with a share of 18.1 per cent of total service imports. These services amounted to about NOK 9.9 billion in the 3rd quarter, which was a decrease of 2.6 per cent from the previous quarter. Oil and gas services had a share of 15.2 per cent of total imports, and these services amounted to about NOK 8.4 billion in the 3rd quarter of 2016.
Transport and storage industry largest export service
Despite a decrease in value of NOK 1.4 billion compared with the previous quarter, enterprises within the transport and storage sector accounted for the largest export of services in the 3rd quarter of 2016, with a share of 44 per cent of the total export value. The second largest sector was enterprises within professional, scientific, and technical activities, with an export value of NOK 7.6 billion.
With regard to the import of services, there are two industries that are competing to be the largest sector, namely non-financial businesses within the mining and quarrying sector and the transportation and storage sector. The mining and quarrying industry accounts for 31.6 per cent, and the transportation and storage sector holds 25.6 per cent of total import value, with about NOK 17.4 and 14.1 billion respectively.
Trading partners in Europe important
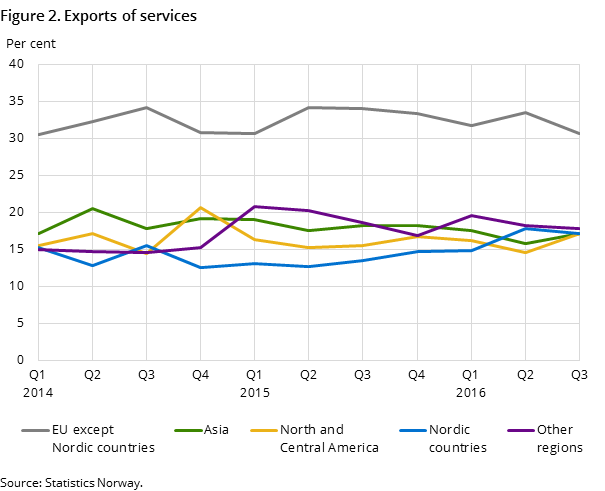
Norwegian non-financial enterprises exported services to European countries in the 3rd quarter of 2016 amounting to NOK 25.9 billion, equivalent to 52.2 per cent of the total export. Export of services to EU countries except Nordic countries, and Nordic countries amounted to 30.7 and 17.2 per cent respectively. Export of services to Asia and North and Central America both amounted to 17.1 per cent.
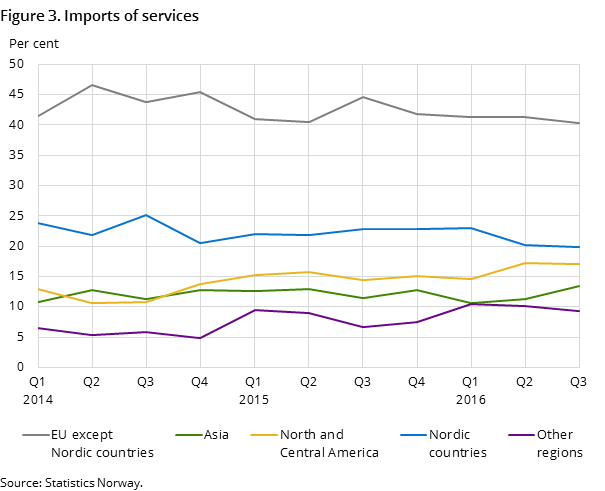
A total of 40.3 per cent of imported services in the 3rd quarter of 2016 came from the EU except Nordic countries, corresponding to NOK 22.2 billion. Nordic countries delivered 19.9 per cent, and countries from North and Central America and Asia delivered 17.1 per cent of Norway’s import of services in the 3rd quarter of 2016.
Contact
-
Noel Hoven
E-mail: noel.hoven@ssb.no
tel.: (+47) 40 78 13 37
-
Jonathan Ho
E-mail: jonathan.ho@ssb.no
tel.: (+47) 40 90 25 82
-
Anne Lyslid Larsen
E-mail: anne.larsen@ssb.no
tel.: (+47) 40 90 23 31
-
Ayfer Erbaydar Storrud
E-mail: ayfer.storrud@ssb.no
tel.: (+47) 97 78 71 85
-
Thomas Moen
E-mail: thomas.moen@ssb.no
tel.: (+47) 93 49 40 32
