Content
Published:
This is an archived release.
Continued price decrease in exported goods
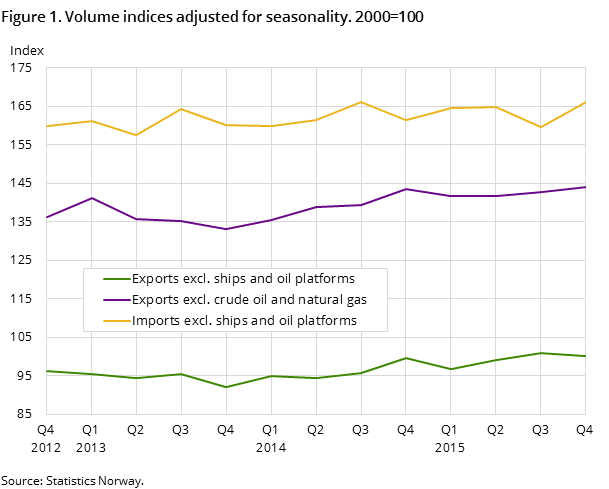
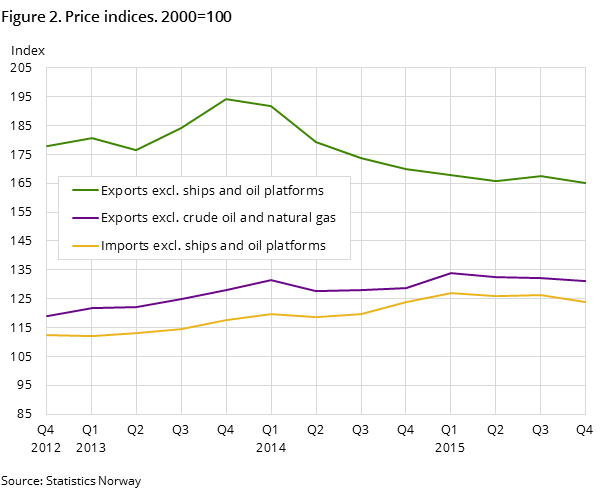
Prices of exported goods fell by almost 4 per cent from the third to the fourth quarter. This was due to lower prices on crude oil and petroleum products, as well as a price reduction for natural gas. The volume of exported goods increased during the same period.
| Volume index | Price index | |||
|---|---|---|---|---|
| Exports | Imports | Exports | Imports | |
| 1Groups according to the Standard International Trade Classification (SITC-Rev. 4). | ||||
| 4th quarter 2015 / 3rd quarter 2015 | ||||
| Goods excl. ships and oil platforms | 8.4 | 7.0 | -3.8 | 1.6 |
| Food, beverages and tobacco | 22.2 | 9.4 | 4.3 | 3.0 |
| Crude materials except fuels | -1.3 | 18.1 | -1.7 | -1.9 |
| Fuels | 8.7 | 17.4 | -6.5 | -10.3 |
| Manufactured goods except food, beverages and tobacco | 4.4 | 5.1 | -1.0 | 2.7 |


From the third to the fourth quarter, prices on exported goods fell 3.8 per cent. Without crude oil, export prices fell by 0.6 per cent during the same period. The prices of exported goods continued to fall due to lower prices on petroleum products, with a decrease of 9.7 per cent.
Compared to the fourth quarter in 2014, prices on petroleum products fell by about 25 per cent to the fourth quarter of 2015. From 2014 to 2015, prices on exported goods fell by 30 per cent; the same price change as for crude oil, Brent Blend measured in NOK, during the same period.
Higher export volume
The volume of Norwegian exports rose by 8.4 per cent from the third to the fourth quarter. This was due to a higher export volume of petroleum products as well as natural gas. Normally, the exported volume of mineral fuels, lubricants and electricity increases during the last quarter of the year. Adjusted for seasonal variations, the export volume for this group fell by approximately 1 per cent from the third to the fourth quarter.
Other product groups with a growth in export volume from the third to the fourth quarter were chemicals, machinery and transport equipment, miscellaneous manufactured articles as well as food. Within the latter group, the volume of exported fish increased by 24.1 per cent. This is less than normal, and adjusted for seasonal variations, the volume of exported fish fell by 2.5 per cent from the third to the fourth quarter of 2015. From 2014 to 2015, the export volume of fish fell by 1.1 per cent.
A fall in the export volume of electricity, of about 11 per cent, dampened the overall rise in the export volume from the third to the fourth quarter. Fewer exports within manufactured goods, due to different kinds of metals, as well as lower exports of crude materials, also moderated the overall rise in the export volume.
Higher import prices
The price index for imported goods increased by 1.6 per cent from the third to the fourth quarter of 2015. Within food, prices rose by about 3 per cent, partly due to higher prices of fruits and vegetables. From the fourth quarter of 2014 to the same quarter in 2015, import prices rose by 15.1 per cent for this food category.
Higher prices on imported food can partly be explained by a weakening of the Norwegian currency. This may also have affected the price development of clothing and shoes, where prices rose between 11 and 14 per cent from the fourth quarter of 2014 to the same quarter in 2015. For clothing and shoes, which are largely imported from China, higher wages may also have affected the price rise during this period.
Highest import volume since the fourth quarter of 2007
The import volume increased by 7 per cent from the third to the fourth quarter. Within food, the import volume rose by 8.3 per cent, due to a 69.5 per cent increase in the volume of fish. It is not abnormal that the fish volume increases during the last quarter of the year. The import volume of vegetables and fruit rose by 16.3 per cent from the third to the fourth quarter. Also within machinery and transport equipment as well as crude materials, the import volume increased. From 2014 to 2015, the annual change for the total imported volume amounted to a 1 per cent increase.
Contact
-
Morten Madshus
E-mail: morten.madshus@ssb.no
tel.: (+47) 40 90 26 94
-
Mats Halvorsen
E-mail: mats.halvorsen@ssb.no
tel.: (+47) 40 90 24 33
