Statistical analysis, 2017
Refugees and political participation – municipal elections 2015
Do refugees get involved in local politics?
Published:
This article was first published in Norwegian, in Statistics Norway’s journal Samfunnsspeilet: Kleven, Øyvin og Vebjørn Aalandslid (2016): Flyktninger og politisk deltakelse – kommunestyrevalget 2015. Deltar flyktningene i lokalpolitikken? Samfunnsspeilet 4/2016. Statistisk sentralbyrå.
Municipal election statistics for 2015 show that immigrants have a lower voter turnout than other voters in Norway, and that refugees are generally no more politically engaged than the majority of immigrants. Refugees from Sri Lanka and Somalia, however, are more politically active than other immigrants from these countries. Two per cent of municipal council representatives are immigrants, three in ten of whom came to Norway as refugees.
- Series archive
- Statistical analysis, 2017
All foreign nationals with three years of legal residence in Norway were given the right to vote in local elections in 1983. The aim was to facilitate the integration of immigrants into our democratic political processes and institutions. Eligible voters in local elections can also stand as candidates on an electoral list and be elected to the municipal council or county council.
Political participation can entail voting in elections, standing as a candidate at elections, taking part in various campaigns and demonstrations, joining political or other interest groups and so on. This article examines three of the most fundamental types of political participation: Who voted in the local elections? Who stood as a list candidate? Who was elected as a representative?
New figures on refugees
This is the first time Statistics Norway has presented figures for immigrants’ voter turnout and electoral representation in municipal councils by reason for immigration and with a particular focus on persons with a refugee background. We know from the literature on political participation that attachment to the labour market increases the likelihood of political engagement. In Norwegian politics, there are several examples of immigrants who originally came to Norway as labour immigrants being drawn into politics through trade unions.
It is likely that some of the refugees who are granted residence in Norway have had to flee their home country because they are political activists and are openly critical of their government. We can therefore expect voter turnout in this group to be higher than among other immigrants. Conversely, many become refugees because their country is at war. Many of the refugees who come to Norway have little experience with transparent, free elections from their homeland, and their knowledge about democratic processes is therefore often limited. These are factors that can point in the opposite direction.
3 in 10 immigrants with the right to vote are former refugees
Thirteen per cent of eligible voters in 2015 were immigrants, compared to just 5 per cent in the municipal and county council elections in 1999. Thus, the figure has tripled in 15 years. Much of the increase is due to the expansion of the EU that started in 2004 with the addition of 11 new member states from Eastern Europe. The 2004 expansion has pushed up labour immigration from countries such as Poland, Lithuania and Latvia.
Just over 500 000 of the roughly 4 million eligible voters at the last election in 2015 were immigrants, 154 000 of whom had a refugee background, i.e. had either fled to Norway and applied for asylum, were reunited with a refugee in Norway, or came to establish a family with a refugee.
For immigrants who arrived after 1990, register data is available on reason for immigration, broken down into five categories: refuge, family, work, education and other reason for immigration. For people with refuge as reason for immigration, there is also good quality data available for some of the years prior to 1990 (Dzamarija 2013:7).
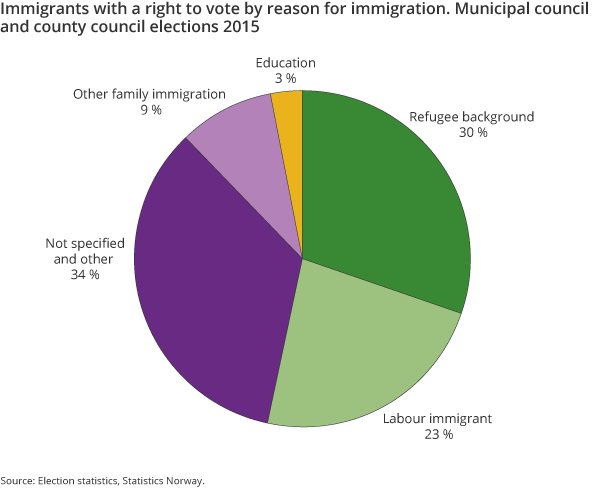
Many of the immigrants who are eligible to vote arrived in Norway long before 1990, and many are from other Nordic countries. In most tables, these are placed in the category ‘not specified and other’. We know that the majority of these were labour immigrants and family immigrants. A total of 113 900 immigrants who were eligible to vote at the last election are what we call primary refugees, i.e. not family immigrants (Table 1). These make up 22 per cent of the immigrants with the right to vote. Of those eligible to vote, 40 100 are family immigrants of primary refugees. These represent 8 per cent of the immigrant voters, and are collectively known as immigrants with a refugee background.
Persons with a refugee background therefore make up 30 per cent of immigrant voters (see Figure 1).
Since the end of World War II, the largest groups of refugees have been from Vietnam, Sri Lanka, Iran, Iraq, the former Yugoslavia, Somalia, Eritrea and now Syria. However, protection has also been granted to people from other countries and regions.
In Table 1, we have divided the eligible voters into the country groups Western Europe etc., East European EEA countries, and Africa, Asia etc., and whether they are Norwegian or foreign nationals. Ninety-six per cent of all refugees were from Africa, Asia, etc., and 78 per cent have become Norwegian citizens. There are approximately 4 500 refugees from East European EEA countries, while a significant number from Western Europe etc. are registered with a refugee background.
Labour immigrants with a Norwegian passport have a higher voter turnout
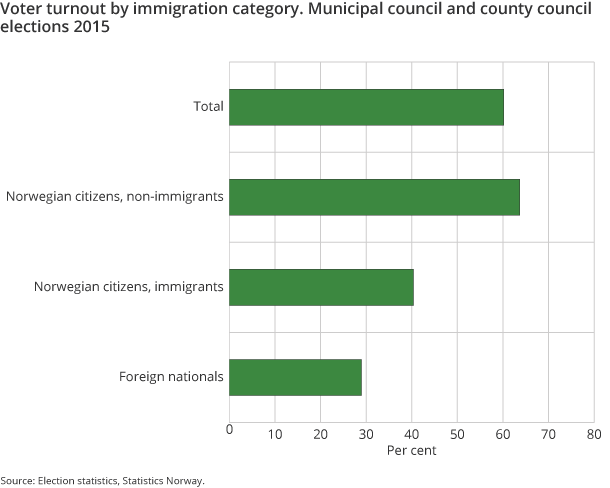
The total voter turnout at the last local elections was 60 per cent. The figure for immigrants is considerably lower than for non-immigrants. This has been the trend ever since Statistics Norway began examining this area in 1983. In the last election, voter turnout for non-immigrants was 64 per cent. Among naturalised immigrants, the figure was 40 per cent, and foreign nationals had a turnout of 29 per cent (see Figure 2).
As already discussed, most immigrants with a refugee background are from Africa, Asia etc. Among Norwegian citizens from these regions, labour immigrants and those who have not stated a reason for immigration have the highest turnout in local elections – between 43 and 45 per cent. However, large shares of both of these groups have been in Norway a long time, and are thereby better integrated into working life and society. This contrasts strongly with labour immigrants (foreign nationals) from East European countries in the EEA, where the turnout is just 6 per cent.
Turnout is also relatively high for a small share of immigrants who are registered with education as their reason for immigration, and who have become naturalised in Norway. The turnout in the 2015 local elections among Norwegian citizens with a refugee background was between 5 and 8 percentage points lower than among labour immigrants and those with an unspecified reason for immigration.
The general trend among immigrants who choose to become Norwegian citizens, and who remain here, seems to be a lower turnout for those with a refugee background. This group therefore appears to be less politically integrated than the labour immigrants.
Length of residence has little bearing on refugees’ turnout
It takes time for immigrants to familiarise themselves with the political system of a new country, and it also takes time to learn the language, norms and rules of a new society. There is therefore reason to believe that immigrants who have been in Norway for a long time are more likely to participate in the elections than those who have not been here long. This concurs with earlier analyses.
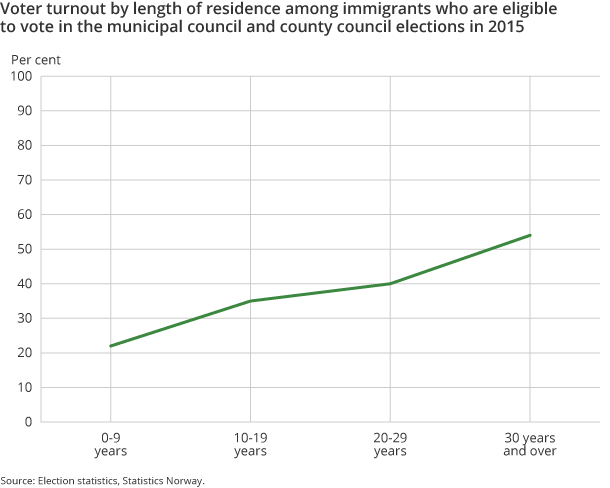
In Figure 3, voter turnout is shown by length of residence divided into two intervals. Regardless of reason for immigration, we see a clear trend of turnout increasing with length of residence. Among those who have been in Norway less than 10 years, turnout averaged 22 per cent. For those who have been here between 10 and 20 years, the turnout increased to 35 per cent. This rises by a further 5 percentage points for those who have lived in Norway between 20 and 30 years (with a 40 per cent turnout). For immigrants who have been here for more than 30 years, the figure is 54 per cent.
There is a correlation between reason for immigration, length of residence and voter turnout. Table 3 only shows figures for immigrants from Africa, Asia etc. because the vast majority of immigrants with a refugee background are from this region.
The general increase shown in Figure 3 does not apply to immigrants with a refugee background. Voter turnout in 2015 is relatively high at 36 per cent among those who have lived in Norway for less than 10 years, and is considerably higher than average for the groups with a different reason for immigration.
Voter turnout then drops to 32 per cent in the group that has lived in Norway 10–20 years. It subsequently increases again to 36 per cent, and further to 44 per cent for those who have lived here more than 30 years (but there are few people in this category).
Table 3 does not capture possible composition effects. For example, many of those who have a refugee background and residence of less than 10 years are from Somalia. Somalis have a relatively high voter turnout compared with immigrants with a different country background.
Initiatives have also been introduced on the introduction programme that teach immigrants about Norwegian society and the political system here. This may help explain why voter turnout is relatively high for those with a refugee background and shortest residence, compared with immigrants who immigrated for other reasons.
Political activity dependent on country background
Refugees from Syria and Sri Lanka make up two of the country groups with the highest voter turnout for immigrants from the southern hemisphere (Africa, Asia etc.), with 46 and 47 per cent respectively in 2015. Average turnout among immigrants from Africa, Asia etc. was 37 per cent. Turnout among refugees from Somalia and Sri Lanka is thus almost 10 percentage points higher than average (see Table 4).
Refugees from Iran and Vietnam had a turnout of 37 and 35 per cent, which is roughly average for the country group Africa, Asia etc. Refugees from Iraq and Syria are below average for these countries, with 31 and 33 per cent voting respectively in the local elections in 2015. A large group of persons with a refugee background in Norway are from Bosnia and Herzegovina. Compared with immigrants from Africa and Asia etc., immigrants from the former Yugoslavia have one of the lowest turnouts. Persons with a refugee background from Bosnia and Herzegovina have a voter turnout of 27 per cent.
If we consider voter turnout in 2015 across the countries where most refugees are from, a clear pattern emerges of refugees voting more often than other immigrants from Iraq, Somalia, Iran and Sri Lanka. However, among Somalis and those from Sri Lanka, voter turnout for refugees is significantly higher than for immigrants as a whole. It should also be noted that there are very few labour and education immigrants from these countries, and the vast majority have come as refugees or family immigrants to such persons.
3 in 10 immigrant representatives are refugees
After foreign nationals were given the right to vote and the right to be appointed to elected bodies in 1983, eight politicians with a minority background were elected onto the municipal councils (Bjørklund and Bergh 2013: 150). The number of representatives with an immigrant background has since risen. A total of 2 300 immigrants stood in the last municipal council elections, which was 4 per cent of all candidates (see Table 5).
Following the 2015 elections, there are now around 260 immigrants in Norwegian municipal councils, which is about 2 per cent of the elected representatives in municipal councils (Table 5). In municipalities with a large immigrant population, such as Oslo and Drammen, the share of immigrants is much higher.
In total, 30 per cent of immigrant representatives in Norwegian municipalities have a refugee background (see Table 6). This is on a par with immigrants with a refugee background who are entitled to vote. These representatives are mainly from Africa, Asia etc.
Why are refugees not more active?
As mentioned previously, all foreign nationals were given the right to vote after three years in Norway in 1983. At that time, the majority of immigrants in Norway were foreign nationals. Voter turnout has been, and continues to be, substantially lower among immigrants than non-immigrants. The authorities, interest groups and political parties have long tried to improve voter turnout (Tronstad and Rogstad 2012). In general, persons with a refugee background are no more active than other immigrants.
It is worth remembering that when universal suffrage for men and women was introduced in Norway in the local elections in 1910, it was due to pressure from large groups who wanted to ‘conquer’ or at least be closely involved in political decisions. The new voting rights partly came about as the result of pressure from these groups’ organised interests, but not everyone began exercising their right to vote straight away. It was not until the interwar period that turnout reached over 70 per cent for women and men, as a result of mobilisation in connection with issues that were important to the voters.
It is wholly conceivable that a form of social integration needs to take place before political integration. Newcomers first need to learn the language and the norms and rules that apply. There is also reason to believe that having more people with the same ethnic background who are involved in politics and who vote in elections will push up voter turnout.
In the literature on voter turnout, there is evidence to suggest that attachment to the labour market has a positive effect on turnout rates. There are several reasons for this, but one key point is that the workplace is a place where people often discuss politics and develop a keener awareness of their own interest in the economy. Employment among immigrants with a refugee background is lower than for other immigrant groups.
Persons with a refugee background are legally integrated into the Norwegian political system through their right to vote and their right to stand as a candidate and be elected onto elected bodies. The big question is whether the majority of non-voters actually feel that they are represented. It is difficult to establish new political alternatives, so anyone wishing to do so must go through the established political parties. For many with a refugee background, understanding the options in Norwegian politics can be difficult, and efforts to find a proper alternative may be futile. Some with a refugee background have also fled from political conflicts and may not want to deal with new political tensions.
References
Bjørklund, T., & Bergh, J. (2013). Minoritetsbefolkningens møte med det politiske Norge: Partivalg, valgdeltakelse, representasjon. Oslo: Cappelen Damm.
Dzamarija, M. T., Andreassen, K. K., & Slaastad, T. I. (2012). Dokumentasjon av registerbasert statistikk over innvandrere og norskfødte med innvandrerforeldre (Internal documents 12/2013). Oslo: Statistics Norway.
Dzamarija, M. T. (2013). Innvandringsgrunn 1990- 2011, hva vet vi og hvordan kan statistikken utnyttes? (Rapporter 34/2013). Retrieved from https://www.ssb.no/befolkning/artikler-og-publikasjoner/innvandringsgrunn-1990-2011-hva-vet-vi-og-hvordan-kan-statistikken-utnyttes
Holmøy, E., & Strøm, B. (2012). Makroøkonomi og offentlige finanser i ulike scenarioer for innvandring (Reports 15/2012). Retrieved from http://www.ssb.no/nasjonalregnskap-og-konjunkturer/artikler-og-publikasjoner/makrookonomi-og-offentlige-finanser-i-ulike-scenarioer-for-innvandring
Tronstad, K. R., & Rogstad, J. (2012). Stemmer de ikke? Politisk deltakelse blant innvandrere og norskfødte med innvandrerforeldre (Fafo report 2012:26). Retrieved from http://www.fafo.no/media/com_netsukii/20253.pdf
Contact
-
Statistics Norway's Information Centre


