Content
Published:
This is an archived release.
Major share of government funding
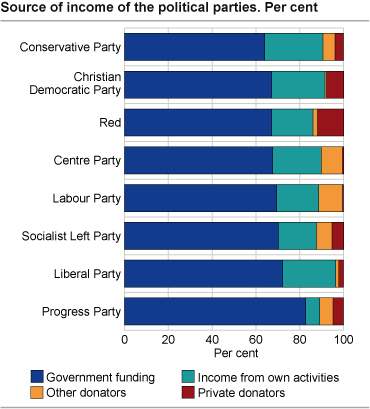
Government funding accounted for 71 per cent of the political parties' income in the election year 2009, about 6 percentage points more than the election year 2005. The proportion was highest for the Progress Party.
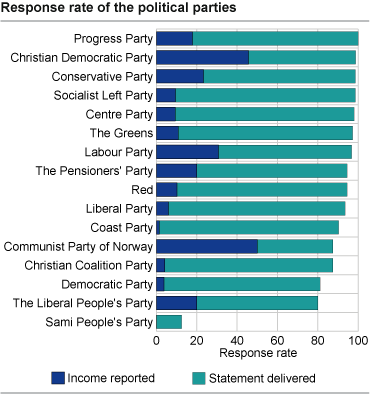
More than three out of four of the party organisations reported that - excluding government funding - they had an income of below NOK 10 000. In total, 622 party organisations reported having an income of at least NOK 10 000 each. They reported to having received NOK 520 million in total, of which government funding accounted for NOK 370 million, while income from own activities accounted for about NOK 100 million. Among the political parties with representation at the Storting, a total of 46 per cent of the organisations of the Christian Democratic Party reported having an income of more than NOK 10 000, whereas only 6 and 7 per cent respectively of the organisations of the Liberal Party and Centre Party reported likewise.
NOK 190 million in governmental funding to the Labour Party and the Progress Party
The governmental funding was mainly given as political party subsidies from the central government. For municipality and county organisations, the party subsidies in 2009 were calculated by using the results of the local elections in 2007. Correspondingly, the subsidies for the main organisations of the political parties were calculated by using the results of the parliamentary election in 2005. The Labour Party received most governmental funding in real terms in 2009 with NOK 120 million, followed by the Progress party with NOK 71 million. Among the political parties with representation at the Storting, the Progress Party had the highest share of government funding at 83 per cent of the party’s total income. The Conservative Party received the smallest share as governmental funding; 64 per cent of its total income. Among the parties without representation at the Storting, the Coast Party reported that government funding represented 92 per cent of their total income.
Labour organisations support the governing parties
The NOK 18.3 million that the Labour Party received from labour organisations, made up about 11 per cent of the party's total income. This accounts for the same share of their total income as in the previous Storting election year in 2005. In total, 76 per cent of the party contributions from the labour organisations went to the Labour Party, while 13 and 11 per cent went to the Socialist Left Party and the Centre Party respectively.
Major part of private donations to the Progress Party, the Christian Democratic Party and the Conservative Party
In total, the political parties received NOK 16.6 million from private donations in the election year 2009, compared to NOK 10.6 million in 2005. The Progress Party was the largest recipient with NOK 4.1 millions. The Christian Democratic Party received NOK 3.5 millions and the Conservative Party received NOK 3.4 millions. As part of the total income, private donations accounted for 8 per cent of the Christian Democratic Party’s total income, while the same figures for the Socialist Left Party and the Progress Party were 5 per cent. Party fees paid by elected representatives constituted a part of private donations.
NOK 19 million in capital income for the Conservative Party and the Labour Party
Capital income accounted for NOK 9.9 million of the Conservative Party’s income and NOK 9.2 million of the Labour Party’s income. This represented 11 per cent of the Conservative Party’s total income. Lotteries, bingo, slot machines and fund raising accounted for 4 per cent of the parties’ total income. .For the Fsmaller parties without representation at the Storting it accounted for 61 per cent of the Democratic Party’s and 38 per cent of the Communist Party of Norway’s total income. As a share of the total, income from own activities fell almost 8 per cent from the Storting election year in 2005 to last year. The reason behind this trend lies mainly on lesser income from capital, but also on lesser income from membership fees.
Membership fees accounts for highest part of the Centre Party’s total income
Membership fees accounted for nearly 5 per cent of the parties’ income, in total. The Centre Party reported having received NOK 5.6 million or 14 per cent of the total income in membership fees in 2009. These fees also were a major part of the total income for the Liberal Party and the Christian Democratic Party, with 9.2 and 6.6 per cent respectively. Among the smallest parties, membership fees accounted for 38.5 per cent of the total income for the Liberal People’s Party, and 28.2 and 19.1 per cent of the total income for the Communist Party of Norway and The Greens, respectively.
More detailed figures are published on www.partifinansiering.no .
Capital incomeComprises capital gains and dividends. About the dataPursuant to the Political Party Act, which came into force in 2005, all registered political parties must report their income every year. The report should give a complete overview of the political party’s income, distributed by source of income. The main sources are government subsidies, income from activities and external donations. The report should also contain a list of major contributors and contributors with which the political party has made a written agreement in political or business matters. Political organisations with less than NOK 10 000 in total income (excluding government subsidies) do not have to report their income, but need to provide a statement saying so is the fact. 2006 was the first year with this type of reporting. The statistics presented here are based on reports submitted in 2010. The deadline was 1 July, and 95 per cent of the party organisations submitted their reports by this date; 3 040 party organisations of the total 3 212. The figures now presented are based on the reports from all the 3 109 party organisations that had responded by 27 August, giving a response rate of 97 per cent. Figure 1 presents the response rate as of 1 July and also shows whether the party organisations had reported income above the NOK 10 000 limit including a breakdown of that income, or whether they had reported their income as below NOK 10 000. The data comprise all registered political parties. Since this is a relatively new data source, there may be uncertainties in the data. The main uncertainty is about whether the income is reported on the correct source, or whether the income is gross income and not net, and whether all the income has been reported. Non-response and exemption due to low income are also sources of uncertainty. |
Tables:
- Table 1 Funding of political parties, by source of income and political party. 2009
- Table 1 Funding of political parties, by source of income and political party. 2009. Per cent
- Table 3 Main organization only. Contributions from labour organizations, enterprises, organizations etc. 1998-2009. NOK 1 000
Contact
-
Terje Risberg
E-mail: terje.risberg@ssb.no
tel.: (+47) 92 62 81 09
-
Tove Bergseteren
E-mail: tove.bergseteren@ssb.no
tel.: (+47) 99 79 08 19
-
Statistics Norway's Information Centre
E-mail: informasjon@ssb.no
tel.: (+47) 21 09 46 42


