Content
Published:
This is an archived release.
NOK 591 million in political party income
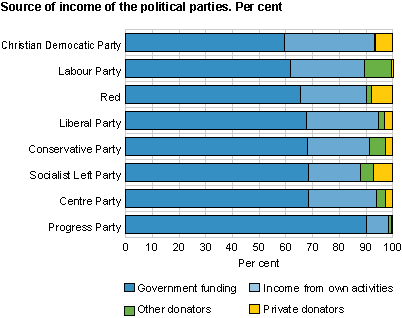
Government funding accounted for 68 per cent of political parties' income in the election year 2011. This is a decrease in the share compared to the last local election year in 2007. Government funding accounted for the smallest share of the Christian Democratic Party and the Labour Party’s funding, and the highest for the Progress Party.
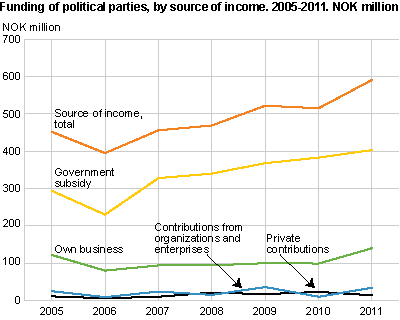
In total, the political parties reported having an income of NOK 591 million, of which government funding accounted for NOK 403 million, while income from own activities accounted for about NOK 140 million. Income as contributions from various organisations and companies accounted for NOK 34 million, and donations from private persons totalled NOK 14 million. The political parties’ income has increased by 30.8 per cent from 2005 to 2011. In general, the price increased by 13.3 per cent over the same time span.
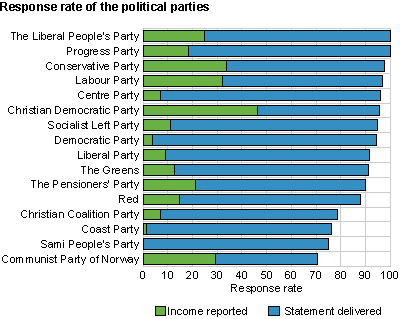
In 2011, 78 per cent of the party organisations reported that - excluding government funding - they had an income of below NOK 10 000. The remaining 22 per cent, in total 704 party organisations, reported income surpassing this amount. Among the political parties with representation at the Storting, a total of 46 per cent of the Christian Democratic Party’s organisations and 31 per cent of the Conservative Party’s organisations reported having an income of more than NOK 10 000, whereas only 7 and 9 per cent of the Centre Party and the Liberal Party’s organisations respectively reported likewise.
NOK 210 million in government funding to the Labour Party and the Conservative Party
The government funding was mainly given as political party subsidies from the central government. For municipality and county organisations, the party subsidies in 2011 were calculated using the results of the local elections in 2007. Correspondingly, the subsidies for the main organisations of the political parties were calculated using the results of the parliamentary election in 2009. The Labour Party received most government funding in real terms in 2011, with NOK 131 million, followed by the Conservative Party with NOK 81 million.
Among the political parties with representation at the Storting, the Progress Party had the highest share of government funding at 90 per cent of the party’s total income. The Christian Democratic Party received the smallest share as government funding; 59 per cent, while the Labour Party’s share was 61 per cent of the total income. Among the parties without representation at the Storting, the Communist Party of Norway and the Liberal Peoples Party reported that government funding represented only 10 per cent of their total income.
Increased capital income with sale of shares
Compared to the last local election year in 2007, the total income of the parties has increased by approximately 30 per cent. The reports do not show major differences in the different income posts, even if a certain decrease in the share of public funding and an increase in the share of income from own activities is evident. In particular, increased capital income contributes to a higher share of income from own activities. A major sale of shares by one of the Labour Party’s county organisations contributes to this.
The share of income from own activities increased by approximately 4 percentage points in 2011 compared to the Storting election year 2009 and the intermediate election year 2010.
Stable income from membership fees
Income from membership fees is stable compared to the level reported in 2010, and this accounts for about 6 per cent of the parties’ total income. There are substantial variations between the parties in this area - from 2 per cent of the Labour Party’s income, to 23, 19 and 17 per cent of the Coastal Party, the Central Party and the Christian Democratic Party’s income respectively.
Contributions from organisations account for 4 per cent of the income
Compared to the years between elections, the election years bring an increase in the contributions from various organisations. In the intermediate election years 2010 and 2008, contributions from organisations accounted for approximately 2 per cent of the total income, while in the election years 2011 and 2009 accounted for 4 and 5 per cent respectively. As an example, the Labour Party received NOK 12.3 million in the local election year 2011 and NOK 18.3 million in the Storting election year 2009 from labour organisations, while the corresponding figure in the intermediate election years was NOK 5.6 million in 2010 and NOK 5.7 million in 2008.
This situation also reflects the differences between election years and years between elections in the total contributions from commercial enterprises. In 2011, these contributions totalled NOK 11.1 million, while in the intermediate years 2010 and 2008 they were NOK 2.2 and 4.1 million respectively. The Conservative Party received 61 per cent - or NOK 6.8 million, of all contributions from commercial enterprises in 2011.
In total, 10 contributions from various organisations and commercial enterprises were more than NOK 500 000 last year. The Labour Party received six of these. Donations to the Labour Party’s youth organisation, AUF, in connection with the Utøya tragedy, also make up a part of this. In total for 2011, the AUF’s central organisation has recorded income from donations of approximately NOK 12.5 million in the aftermath of the tragedy.
NOK 14 million from private donors
The total amount the political parties received from private donations last year was NOK 14.2 million. Private donations accounted for about 2 per cent of the income in total; a share that is comparable to the level of private donations in the last local election year. Compared with the previous two years, this is still a decline - both as a share of the total income and in actual numbers.
Among the political parties with representation at the Storting, the Socialist Left Party and the Christian Democratic Party had the highest share of their income from private donations, with approximately 7 per cent. For some time, there has been a tradition within the Socialist Left Party where elected representatives donate a part of their income to the party. In total, 11 donations were more than NOK 100 000 - and seven of these were received by the Conservative Party.
More detailed figures are published on www.partifinansiering.no/english/ .
Capital incomeThe parties’ capital income comprises capital gains and dividends. About the dataPursuant to the Political Party Act, which came into force in 2005, all registered political parties must report their income every year. The report should give a complete overview of the political party’s income, distributed by source of income. The main sources are government subsidies, income from activities and external donations. The report should also contain a list of major contributors and contributors with which the political party has a written agreement in political or business matters. Political organisations with less than NOK 10 000 in total income (excluding government subsidies) do not have to report their income, but need to provide a statement giving this information. This type of reporting was introduced in 2006. The statistics presented here are based on reports submitted in 2012. The deadline was 1 July, and 92 per cent of the party organisations submitted their reports by this date; 3 030 party organisations out of the total 3 310. The figures now presented are based on the reports from all the 3 137 organisations that had responded by 21 August, giving a response rate of 95 per cent. Figure 1 presents the response rate as of 1 July and also shows whether the party organisations had reported income above the NOK 10 000 limit including a breakdown of that income, or whether they had reported their income as below NOK 10 000. The data comprise all registered political parties. Further information is available in About the statistics, section 5. |
Tables:
- Table 1 Funding of political parties, by source of income and political party. 2011
- Table 2 Funding of political parties, by source of income and political party. 2011. Per cent
- Table 3 Main organization only. Contributions from labour organizations, enterprises, organizations etc. 1998-2011. NOK 1 000
Contact
-
Terje Risberg
E-mail: terje.risberg@ssb.no
tel.: (+47) 92 62 81 09
-
Tove Bergseteren
E-mail: tove.bergseteren@ssb.no
tel.: (+47) 99 79 08 19
-
Statistics Norway's Information Centre
E-mail: informasjon@ssb.no
tel.: (+47) 21 09 46 42


