Content
Published:
This is an archived release.
The petrol stations sold for NOK 3.8 billion
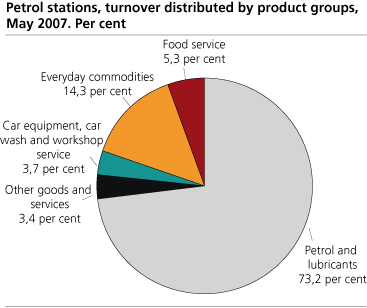
The petrol stations sold for NOK 3.8 billion in May this year. This is NOK 200 million, or 5.6 per cent, more than in May 2006. Food service increased the most.
The turnover for engine fuel and lubricants increased by more than NOK 161 million the same period. This is equivalent to an increase of 6.1 per cent. Compared with May 2006, the turnover of food service and everyday commodities had an increase of 13.4 and 4.6 per cent respectively.
Food service increased most of all
The first five month this year, food service increased most of all. The turnover for this group was NOK 114.8 million, or 14.8 per cent, more than the same period in 2006. In the same period the turnover of everyday commodities rose by NOK 130.8 million, or 6.1 per cent. From January to May this year, the petrol stations sold engine fuel and lubricants for NOK 346.7 million more, compared with the same period in 2006.
| Petrol stations, turnover statistics |
| Turnover | Change in per cent | ||||||||||||||||||||||||||||||||||||||
|---|---|---|---|---|---|---|---|---|---|---|---|---|---|---|---|---|---|---|---|---|---|---|---|---|---|---|---|---|---|---|---|---|---|---|---|---|---|---|---|
| May 2007 | January-May 2007 |
May 2006-
May 2007 |
January-May 2006-
January-May 2007 |
||||||||||||||||||||||||||||||||||||
| Total | 3 815 682 | 16 662 774 | 5.6 | 4.0 | |||||||||||||||||||||||||||||||||||
| Petrol and lubricants | 2 794 353 | 12 098 257 | 6.1 | 3.0 | |||||||||||||||||||||||||||||||||||
| Car equipment | 72 500 | 390 287 | -1.5 | 10.7 | |||||||||||||||||||||||||||||||||||
| Everyday commodities | 547 290 | 2 269 111 | 4.6 | 6.1 | |||||||||||||||||||||||||||||||||||
| Other goods including music and video sales | 107 193 | 494 259 | -3.4 | 2.4 | |||||||||||||||||||||||||||||||||||
| Food service | 201 934 | 889 298 | 13.4 | 14.8 | |||||||||||||||||||||||||||||||||||
| Workshop service and car wash | 68 503 | 405 967 | 4.8 | 3.6 | |||||||||||||||||||||||||||||||||||
| Renting | 12 444 | 52 629 | 8.8 | 10.5 | |||||||||||||||||||||||||||||||||||
| Games/commision | 11 465 | 62 966 | -40.6 | -26.9 | |||||||||||||||||||||||||||||||||||
Tables:
The statistics is published with Index of wholesale and retail sales.
Contact
-
Statistics Norway's Information Centre
E-mail: informasjon@ssb.no
tel.: (+47) 21 09 46 42

