Content
Published:
This is an archived release.
More food service on petrol stations
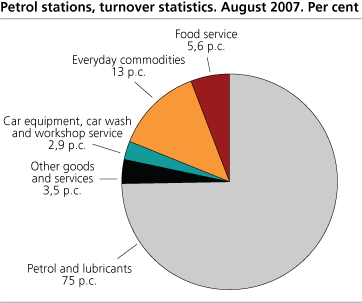
In August this year, the turnover of food service increased by 13.3 per cent compared with the same period last year. In August 2007, the petrol stations’ total turnover was 1.2 per cent higher compared with the same month last year.
The 13.3 per cent growth in turnover of food service amounts to NOK 28.7 million. The petrol stations total turnover rose by NOK 186 million, or 1.2 per cent. The total turnover was NOK 3.8 billion in August this year.
Increased turnover for everyday commodities
Turnover of everyday commodities rose by 2.8 per cent from August 2006 to August 2007. By comparison, grocery shops in Norway had an increase of 7.2 per cent the same month. The turnover for engine fuel and lubricants decreased by 0.1 per cent the same period.
NOK 982 million the first eight months
The first eight months this year, the turnover of petrol stations in Norway rose by more than NOK 982 million or 3.6 per cent, compared with the same period last year. In the same period, the turnover for engine fuel and lubricants increased by NOK 614 million, or 3.0 per cent. The first eight month this year, food service increased by NOK 186 million or 13.8 per cent, compared to the same period last year.
| Petrol stations, turnover statistics |
| Turnover | Change in per cent | ||||||||||||||||||||||||||||||||||||||
|---|---|---|---|---|---|---|---|---|---|---|---|---|---|---|---|---|---|---|---|---|---|---|---|---|---|---|---|---|---|---|---|---|---|---|---|---|---|---|---|
| August 2007 |
January-
August 2007 |
August 2006-
August 2007 |
January-August 2006-
January-August 2007 |
||||||||||||||||||||||||||||||||||||
| Total | 3 811 813 | 28 434 047 | 1,2 | 3,6 | |||||||||||||||||||||||||||||||||||
| Petrol and lubricants | 2 857 945 | 20 836 513 | -0.1 | 3.0 | |||||||||||||||||||||||||||||||||||
| Car equipment | 55 758 | 582 667 | -1.5 | 7.6 | |||||||||||||||||||||||||||||||||||
| Everyday commodities | 497 129 | 3 851 398 | 2.8 | 4.1 | |||||||||||||||||||||||||||||||||||
| Other goods including music and video sales | 100 698 | 848 253 | -3.7 | -2.4 | |||||||||||||||||||||||||||||||||||
| Food service | 213 565 | 1 533 282 | 13.3 | 13.8 | |||||||||||||||||||||||||||||||||||
| Workshop service and car wash | 54 403 | 580 037 | 29.6 | 6.5 | |||||||||||||||||||||||||||||||||||
| Renting | 13 691 | 95 171 | 3.3 | 9.2 | |||||||||||||||||||||||||||||||||||
| Games/commision | 18 624 | 106 726 | 8.0 | -23.7 | |||||||||||||||||||||||||||||||||||
Tables:
The statistics is published with Index of wholesale and retail sales.
Contact
-
Statistics Norway's Information Centre
E-mail: informasjon@ssb.no
tel.: (+47) 21 09 46 42

