Content
Published:
This is an archived release.
Sales up by 9.6 per cent
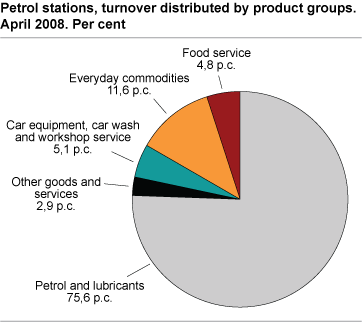
The turnover for Norwegian petrol stations rose by 9.6 per cent or NOK 326.7 million in April compared with the same month last year. The turnover was NOK 3.7 billion in April 2008.
The turnover of engine fuel and lubricants increased by 16.4 per cent or nearly NOK 399 million from April last year to April this year. Workshop services and car wash sales increased by 26.2 per cent in the same period. This is equivalent to a rise of NOK 22 million, mainly due to car wash sales.
Easter in March influenced sales
The petrol stations turnover of everyday commodities and other goods including music and video sales
decreased by 14.5 and 23.6 per cent respectively from April last year to April this year. This is in large part because Easter was in April last year, while it was in March this year. On the other hand, food service was at the same level as last year.
NOK 14.2 billion in the first four months
In the first four months of this year, the petrol stations in Norway sold for NOK 14.2 billion. This is an increase of NOK 1.3 billion or 10.3 per cent from the same period last year. Petrol sales rose by 14.2 per cent, while food service and everyday commodities rose by 5.4 and 0.3 per cent respectively.
| Turnover | Change in per cent | ||||||||||||||||||||||||||||||||||||||
|---|---|---|---|---|---|---|---|---|---|---|---|---|---|---|---|---|---|---|---|---|---|---|---|---|---|---|---|---|---|---|---|---|---|---|---|---|---|---|---|
| April 2008 | January-April 2008 |
April 2007-
April 2008 |
January-April 2007-
January-April 2008 |
||||||||||||||||||||||||||||||||||||
| Total | 3 744 894 | 14 168 110 | 9.6 | 10.3 | |||||||||||||||||||||||||||||||||||
| Petrol and lubricants | 2 831 892 | 10 627 534 | 16.4 | 14.2 | |||||||||||||||||||||||||||||||||||
| Car equipment | 84 533 | 280 884 | -1.0 | -11.6 | |||||||||||||||||||||||||||||||||||
| Everyday commodities | 434 020 | 1 727 572 | -14.5 | 0.3 | |||||||||||||||||||||||||||||||||||
| Other goods including music and video sales | 79 339 | 345 147 | -23.6 | -10.8 | |||||||||||||||||||||||||||||||||||
| Food service | 181 421 | 724 645 | -0.1 | 5.4 | |||||||||||||||||||||||||||||||||||
| Workshop service and car wash | 105 998 | 354 447 | 26.2 | 5.0 | |||||||||||||||||||||||||||||||||||
| Renting | 9 709 | 36 960 | -15.8 | -8.0 | |||||||||||||||||||||||||||||||||||
| Games/commision | 17 982 | 70 921 | 58.3 | 37.7 | |||||||||||||||||||||||||||||||||||
Tables:
The statistics is published with Index of wholesale and retail sales.
Contact
-
Statistics Norway's Information Centre
E-mail: informasjon@ssb.no
tel.: (+47) 21 09 46 42

