Content
Published:
This is an archived release.
More ready-made food at petrol stations
Norwegian petrol stations had an increase in turnover of 11 per cent from June last year to June this year. The explanation is high petrol prices and increased sales of ready-made food.
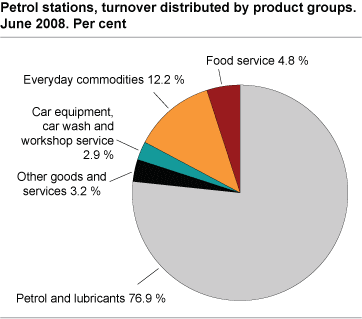
Norwegians increasingly buy ready-made food at petrol stations. The turnover of hot dogs, pizza, buns and other ready-made food rose by NOK 8 million or 3.9 per cent from June last year to June this year. The sales of ready-made food now accounts for approximately 5 per cent of the total turnover of the country’s petrol stations.
Nevertheless, the sales of engine fuel accounts for the principal part of the increase in turnover of Norwegian petrol stations. The turnover of engine fuel rose by NOK 480 million or 16.3 per cent from June last year to June this year. This large rise in turnover is mainly due to higher prices. The Consumer price index shows that the prices of engine fuel and lubricants rose by 12.7 per cent from June last year to June this year.
The turnover of other commodities than engine fuel and ready-made food decreased in June compared with the same month last year. Petrol stations had a lower turnover of car equipment, everyday commodities, music, video, renting and workshop service. There was a rise in turnover of games/commission, but these figures are not comparable with previous figures.
Turnover of NOK 22.8 billion
The first half-year of this year petrol stations in Norway had a turnover of NOK 22.8 billion. Engine fuel and lubricants came to 17.1 billion or 75 per cent. Everyday commodities, food service and other goods including music and video amounted to a total of NOK 4.6 billion or 20.1 per cent of the total turnover of the first half-year. Car equipment and workshop service/car wash came to NOK 914 billion or 4.0 per cent.
The rise in turnover of engine fuel and lubricants was 13.9 per cent in the first half-year of this year compared with the same period last year. Other commodities had a decline in turnover of 7.9 per cent, while the turnover of food service and everyday commodities, on the other hand, increased by 4.9 and 1.1 per cent respectively.
| Turnover | Change in per cent | ||||||||||||||||||||||||||||||||||||||
|---|---|---|---|---|---|---|---|---|---|---|---|---|---|---|---|---|---|---|---|---|---|---|---|---|---|---|---|---|---|---|---|---|---|---|---|---|---|---|---|
| June 2008 | January-June 2008 |
June 2007-
June 2008 |
January-June 2007-
January-June 2008 |
||||||||||||||||||||||||||||||||||||
| Total | 4 442 773 | 22 771 307 | 11.7 | 10.3 | |||||||||||||||||||||||||||||||||||
| Petrol and lubricants | 3 415 726 | 17 122 241 | 16.3 | 13.9 | |||||||||||||||||||||||||||||||||||
| Car equipment | 63 728 | 414 421 | -8.1 | -9.8 | |||||||||||||||||||||||||||||||||||
| Everyday commodities | 542 641 | 2 850 868 | -1.4 | 1.1 | |||||||||||||||||||||||||||||||||||
| Other goods including music and video sales | 112 753 | 568 211 | -8.1 | -7.9 | |||||||||||||||||||||||||||||||||||
| Food service | 213 175 | 1 147 648 | 3.9 | 4.9 | |||||||||||||||||||||||||||||||||||
| Workshop service and car wash | 63 574 | 500 066 | -4.9 | 5.8 | |||||||||||||||||||||||||||||||||||
| Renting | 12 549 | 60 651 | -7.1 | -8.3 | |||||||||||||||||||||||||||||||||||
| Games/commision | 18 627 | 107 201 | 57.8 | 43.4 | |||||||||||||||||||||||||||||||||||
Tables:
The statistics is published with Index of wholesale and retail sales.
Contact
-
Statistics Norway's Information Centre
E-mail: informasjon@ssb.no
tel.: (+47) 21 09 46 42

