Content
Published:
This is an archived release.
Oslo spends most on personal well-being
Oslo county topped the average spending on hairdressing and other beauty treatments in 2007. On average, every Oslo citizen spent NOK 1 950 on these services, while the figure for Rogaland and Sør Trøndelag was also above the national average, with average spending figures of NOK 1 580 and NOK 1 569 respectively.
At the other end of the scale, the inhabitants of Aust-Agder, Østfold and Finnmark counties only spent NOK 1 185, NOK 1 182 and NOK 1 179 respectively.
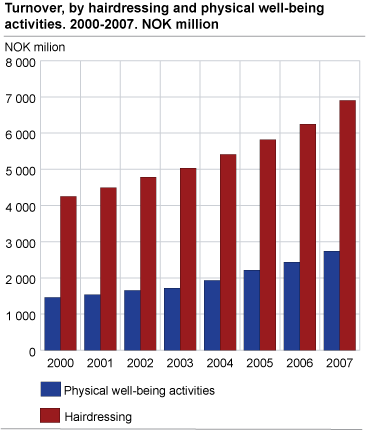
The establishments within hairdressing and other beauty treatments had a turnover of NOK 6.9 billion in 2007; an increase of 10.6 per cent compared to 2006.
The industry subclass consisted of 7 392 local KAUs in 2007; an increase of 3.6 per cent in 2007. The number of persons employed rose by 4.3 per cent to 16 099. The compensation of employees increased by 14.2 per cent to NOK 2.6 billion.
Growth for physical well-being activities
The local KAUs within physical well-being activities had an increase in turnover of 12.4 per cent to NOK 2.7 billion. The number of persons employed was 5 334 and the compensation of employees amounted to NOK 935 million.
Washing and dry-cleaning of textiles and for products
The total turnover in this industry class was NOK 2 billion in 2007; an increase of 7.6 per cent compared with 2006. The employment rose by 1 per cent to 2 713 persons.
Statistics on enterprise level
The structural business statistics for construction are compiled on local KAU level and on enterprise level. The figures on enterprise level may differ from figures on local KAU level. This is due to some enterprises being registered in one industry group according to main activity, while at the same time consisting of local KAUs in other groups.
Revision of industriesIn 2007, the enterprises in Statistics Norway's Central Register of Establishments and Enterprises were coded in accordance with the new Standard Industrial Classification (SN2007). The structural business statistics will be published in accordance with the new Standard Industrial Classification (SN2007) for the statistical year 2008 in November 2009. One of the major changes is that personal services will be moved into a new section, Other service activities. |
Tables:
- Table 1 Personal services. Principal figures, by industry class. Local kind-of-activity units. 2006 and 2007
- Table 2 Personal services. Principal figures, by number of persons employed. Local kind-of-activity units. 2007
- Table 3 Hairdressing and other beauty treatment. Principal figures, by county. 2006 and 2007
- Table 4 Physical well-beeing activities. Principal figures, by county. 2006 and 2007
- Table 5 Personal services. Principal figures, by region. Local kind-of-activity units. 2007
- Table 6 Personal services. Principal figures, by industry class. Enterprises. 2006 and 2007
- Table 7 Personal services. Principal figures, by number of persons employed. Enterprises. 2007
- Table 8 Personal services. Gross Investments, by group of fixed assets and industry class. Enterprises. 2007
- Table 9 Personal services. Gross Investments, by category and industry class. Enterprises. 2007
- Table 10 Hairdressing and other beauty treatment. Turnover per inhabitant, by county. 2007
The statistics is now published as Business statistics.
Additional information
Preliminary figures have fewer variables than final figures and are only published at enterprise level.
Contact
-
Statistics Norway's Information Centre
E-mail: informasjon@ssb.no
tel.: (+47) 21 09 46 42

