Content
Published:
This is an archived release.
Wholesale and retail trade rose by NOK 100 billion
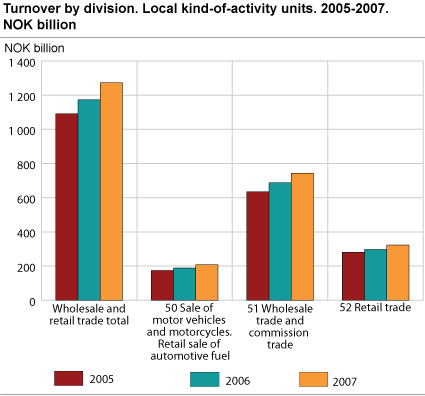
The turnover of local kind-of-activity units in the wholesale and retail trade, repair of motor vehicles and household goods, reached NOK 1 273.3 billion in 2007. The turnover rose by NOK 100.7 billion, or 8.6 per cent, from 2006 to 2007.
The total number of local kind-of-activity units in the sector was 68 558 in 2007; an increase of 1 353 units from the year before. The total number of persons employed in 2007 was 370 529; an increase of 4.0 per cent from 2006. The compensation of employees rose by 11.6 per cent in the same period of time. The total investments amounted to NOK 12.2 billion, increasing by 19.5 per cent.
2 per cent of the local kind-of-activity units contributed to almost 40 per cent of the turnover
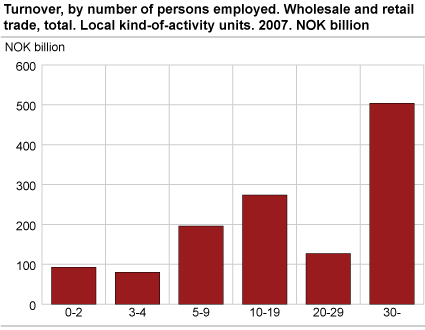
In 2007, the 1 405 local KAUs with 30 or more people employed, or 2.0 per cent of the total population, contributed with 39.6 per cent, or NOK 503.9 billion of the total turnover in the wholesale and retail trade, repair of motor vehicles and household goods. The 34 082 local KAUs, or 49.7 per cent of the total population, with two or fewer persons employed contributed with 7.3 per cent, or NOK 92.6 billion, of the total turnover.
More than NOK 320 billion in retail trade
The local kind-of-activity units in retail trade, excluding motor vehicles and motorcycles, had a turnover of NOK 322.7 billion in 2007; an increase of NOK 25.8 billion, or 5.7 per cent, from 2006.
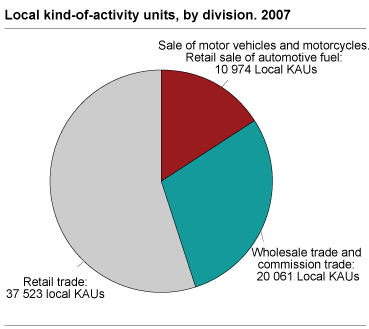
The investments were 5.1 billion. The number of employed persons in the industry increased by 7 186, or 3.7 per cent. The number of persons employed in the industry was 199 633, while the number of local kind-of-activity units increased by 2.3 per cent to 37 523.
Strong growth for investments in motor vehicles and petrol
The local kind-of-activity units within sale and maintenance of motor vehicles and automotive fuel had an increase in investments of NOK 523.2 billion or 37.1 per cent from 2006 to 2007. Total investments amounted to NOK 1.9 billion. The total turnover was NOK 208.0 billion in 2007. The number of local KAUs was 10 974, while the number of persons employed in the industry was
60 468 and the compensation of employees amounted to NOK 20.2 billion in 2007.
NOK 743 billion in agency and wholesale trade
The local kind-of-activity units in agency and wholesale trade, excluding motor vehicles and motorcycles, had a turnover of NOK 742.6 billion in 2007; an increase of 8.0 per cent from 2006. The number of persons employed in the industry was 110 428 in 2007, while the number of local kind-of-activity units was 20 061. The compensation of employees and investments amounted to NOK 54.0 and NOK 5.1 billion respectively.
All turnovers in the structure statistics are excluding VAT.
Enterprise statisticsThe structure statistics are published both on enterprise and local kind-of-activity unit level. The figures for enterprises will normally differ from the ones at local kind-of-activity units because enterprises registered according to main activity may have local KAUs with activity in other industries. For more information and further definitions, go to “About the statistics”. |
Revision of local kind-of-activities 2006Local kind-of-activity units are revised in certain industries. Modifications are only significant on a detailed activity level within certain geographic areas. Enterprise level is unchanged. |
Revision of industriesIn 2007, the enterprises in Statistics Norway’s Central Register of Establishments and Enterprises were coded in accordance with the new Standard Industrial Classification (SN2007). Petrol stations have been included in the retail industry and industries were also split up in order to improve the sector statistics. As an example, sport shops and kiosks have been separated as proper industries. The new Standard Industrial Classification (SN2007) will be used for the first time in the publishing of preliminary figures for the statistical year of 2008, in October 2009. For general information about the transition to the new Standard Industrial Classification click here |
Comparisons with other European countries
For international comparisons, go to EUROSTAT .
Tables:
- Table 1 Principal figures by industry group. Local kind-of-activity units. 2006 and 2007
- Table 2 Principal figures by number of persons employed and industry group. Local kind-of-activity units. 2007
- Table 3 Principal figures for the industrial section by county. Local kind-of-activity units. 2007
- Table 4 Prinsipal figures, by region and industry group. Local KAUs. 2007
- Table 5 Principal figures, by industry group. Enterprises. 2006 and 2007
- Table 6 Principal figures, by number of persons employed and industry group. Enterprises. 2007
- Table 7 Investments, by group of fixed assets and industry group. Enterprises. 2007
- Table 8 Gross investments, by category and industry group. Enterprises. 2007
- Table 9 Gross earnings on merchandise sold, by industry group. Enterprises. 2007
- Table 10 Specification of turnover by different industries and industry group, expressed in percentages. Enterprises. 2007
- Table 11 Change in total stocks of goods and services and in stocks of goods and services purchased for resale, by industry group. Enterprises. 2007
The statistics is now published as Business statistics.
Additional information
The statistics have figures for both local KAUs and enterprises, but preliminary figures are published only on enterprise level.
The figures for enterprises will deviate from the figures for local KAUs. The reason is that enterprises that are registered with principal activity in one industry may have local KAUs with activities in other industries.
Read more in About the statistics .
Contact
-
Statistics Norway's Information Centre
E-mail: informasjon@ssb.no
tel.: (+47) 21 09 46 42


