Content
Published:
This is an archived release.
Decline in wholesale and retail trade in 2009
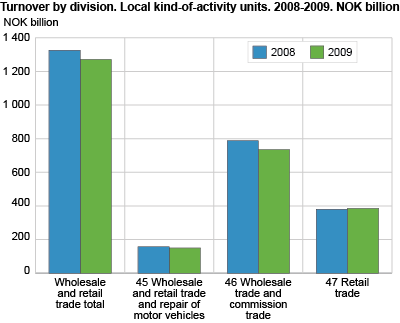
The combined turnover for the local kind-of-activity units within wholesale and retail trade; repair of motor vehicles and motorcycles decreased by around 4.1 per cent from 2008 to 2009. This was the first year since 2002 that showed a decrease in turnover relative to the previous year.
The total turnover amounted to NOK 1 271 billion; a decrease of about 4.1 per cent from 2008.
Decline in the number of units and employed
There were 812 fewer local kind-of-activity units and 4 790 fewer persons employed in 2009 than in 2008. Thus both the number of local kind-of-activity units and the number of employed persons went down by a little more than 1 per cent. There were a total of 67 078 local kind-of-activity units and 369 419 persons employed within wholesale and retail trade; repair of motor vehicles and motorcycles in 2009. Compensation of employees amounted to NOK 128.6 billion, while gross investments amounted to NOK 7.6 billion. See also the quarterly investments statistics for retail trade.
Labour intensive small local kind-of-activity units
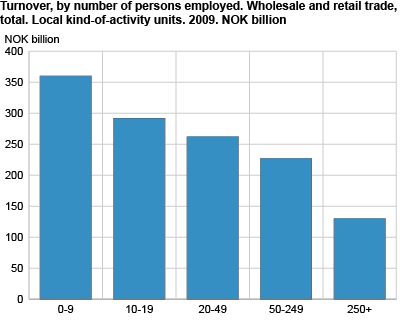
Local kind-of-activity units with less than 10 persons employed accounted for slightly less than 85 per cent of the total number of units within wholesale and retail trade, about the same as in 2008. These local kind-of-activity units had a turnover per employed person of around NOK 2.4 million. By comparison, the local kind-of-activity units with 50 or more persons employed, which accounted for 0.8 per cent of the units, had a turnover per employed person of NOK 6.7 million.
If we look at the wholesale and retail trade industries as a whole, the turnover per employed person amounted to NOK 3.4 million. Although the proportion of units with fewer than 10 persons employed is about the same for all three main industries, Retail trade, except of motor vehicles and motorcycles is the most labour intensive of the three, with a turnover per employed person of NOK 1.8 million. Least labour intensive are the units within Wholesale trade, except of motor vehicles and motorcycles , with a turnover per employed person of around NOK 6.6 million. Within Wholesale and retail trade and repair of motor vehicles and motorcycles the turnover per employed person was almost NOK 3.4 million.
Largest decrease in Oslo
All but two counties experienced a decline in retail sales from 2008 to 2009. In the county Sogn og Fjordane the turnover increased by 6.6 per cent, to NOK 20.3 billion, while it increased by 4.5 per cent, to NOK 16.6 billion, in the county Nord-Trøndelag. With a decline in turnover of 6.7 per cent, or nearly NOK 24 billion, Oslo was the county that experienced the largest decrease from 2008 to 2009.
Slight increase in retail trade
Despite a decline in turnover for wholesale and retail trade as a whole, the turnover within Retail trade, except of motor vehicles and motorcycles increased by 1.4 per cent. A total of NOK 386 billion was traded. The index of retail sales shows an increase of 2.4 per cent for the same period. The number of employed persons decreased by 1 486 persons. It was particularly units within Retail sale in non-specialised stores that helped to drive up turnover in the retail trade. This is the largest industry group within the retail division, as it accounts for about 39 per cent of the turnover. This is also where we find the grocery stores. With an increase of 5.8 per cent from the year before, turnover in the industry group totalled NOK 149 billion in 2009. At the opposite end we find gas stations, which experienced a decrease of NOK 3.5 billion, or 7.5 per cent. With NOK 43 billion, this industry group represents roughly 11 per cent of turnover in retail trade.
Another year with decline in turnover for motor vehicles and motorcycles
For the second consecutive year, the total turnover of local kind-of-activity units engaged in trade and repair of motor vehicles and motorcycles fell by over 4 per cent, ending at a total of NOK 150.4 billion for 2009. This is a decrease of NOK 6.7 billion from 2008. The decline was fairly evenly distributed between the different groups in the industry division, apart from Sale of motor vehicle parts and accessories , which experienced an increase in turnover of 2.2 per cent from 2008.
The number of local kind-of-activity units was fairly stable, with a slight decrease of 20 units, while the number of employed persons fell by just over 600 persons, to a little more than 44 300 persons employed.
Great variation in the development of turnover within wholesale trade
With NOK 232 billion, the industry group Wholesale of food, beverages and tobacco accounted for nearly 32 per cent of the turnover within wholesale trade, and was thus the largest group within the industry division. Second largest was the retail sector, which, with a turnover of NOK 209 billion, accounted for roughly 28 per cent. While the former of these two industry groups experienced an increase in turnover of 6.3 per cent, the turnover for the second decreased by 19.2 per cent from 2008 to 2009.
The combined turnover for the nearly 19 800 local kind-of-activity units within wholesale trade amounted to NOK 735 billion; a decline of 6.7 per cent from 2008. Employment decreased by 2 688 persons, or 2.4 per cent, to a total of 111 593 employed persons.
TurnoverTurnover in the structure statistics is excluding VAT. |
Enterprise statisticsThe structure statistics are published both on enterprise and local kind-of-activity unit level. The figures for enterprises will normally differ from the ones at local kind-of-activity units because enterprises registered according to main activity may have local KAUs with activity in other industries. For more information and further definitions, see About the statistics . |
Comparisons with other European countriesFor international comparisons, see EUROSTAT . |
Tables:
- Table 1 Principal figures, by industry group. Local kind-of-activity units. 2008 and 2009
- Table 2 Principal figures, by number of persons employed and industry group. Local kind-of-activity units. 2009
- Table 3 Principal figures for the industrial section, by county. Local kind-of-activity units. 2009
- Table 4 Principal figures, by industry group. Enterprises. 2008 and 2009
- Table 5 Principal figures, by number of persons employed and industry group. Enterprises. 2009
The statistics is now published as Business statistics.
Additional information
The statistics have figures for both local KAUs and enterprises, but preliminary figures are published only on enterprise level.
The figures for enterprises will deviate from the figures for local KAUs. The reason is that enterprises that are registered with principal activity in one industry may have local KAUs with activities in other industries.
Read more in About the statistics .
Contact
-
Statistics Norway's Information Centre
E-mail: informasjon@ssb.no
tel.: (+47) 21 09 46 42


