Content
Published:
This is an archived release.
Continued growth for wholesale and retail trade in 2011
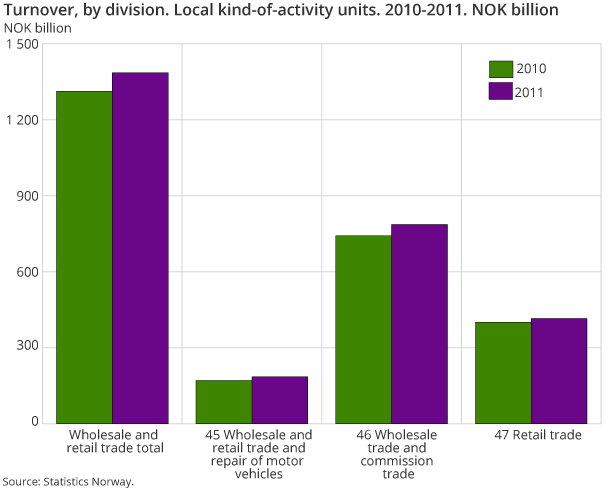
The growth in wholesale and retail trade continued in 2011 with a rise of 5.6 per cent from 2010.
| 2011 | Change in per cent | ||
|---|---|---|---|
| 2010 - 2011 | 2009 - 2011 | ||
| Enterprises | |||
| Number of enterpriser | 50 966 | -0.7 | -3.4 |
| Employment (persons) | 364 577 | -0.8 | -1.2 |
| Turnover (NOK million) | 1 344 408.7 | 4.9 | 8.5 |
| Value added (NOK million) | 187 501.5 | 2.5 | 4.4 |
| Gross operating surplus (NOK million) | 54 109.3 | 3.0 | 5.7 |
| Local kind-of-activity units | |||
| Local KAUs | 65 595 | -0.2 | -2.2 |
| Employment (persons) | 367 324 | -0.4 | -0.6 |
| Turnover (NOK million) | 1 385 325.8 | 5.6 | 9.0 |
| Compensation of employees (NOK million) | 135 111.4 | 2.8 | 5.1 |
| Gross investments (NOK million) | 9 472.1 | 14.5 | 24.7 |
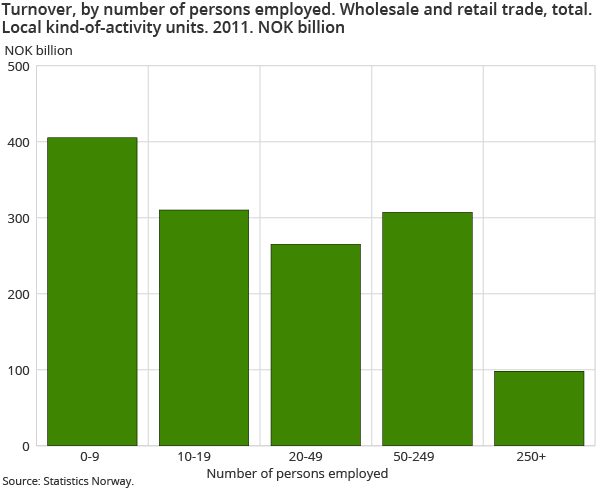
Total turnover for 2011 amounted to NOK 1 385 billion. This is 4.5 per cent more than the total turnover in the record year 2008.
Large increase in gross investments
Gross investments increased by 14.5 per cent, or NOK 1.2 billion. The number of local KAUs and employed persons showed a slight decline in 2010 from the previous year, of 0.2 and 0.4 per cent respectively.
Greatest growth in Finnmark
Finnmark was the county that, with an increase of 10.2 per cent or NOK 1 billion, experienced the greatest percentual growth from 2010 to 2011. Nordland was a close second, with a growth of 8.6 per cent, or NOK 3.4 billion. With an increase of NOK 20 billion, or 6.1 per cent, Oslo was the county that experienced the largest increase in turnover in monetary terms. Telemark and Sogn og Fjordane were the only counties to experience a decline.
A good year for petrol stations
Petrol stations accounted for almost 12 per cent of the turnover within retail trade, and experienced a growth of 8 per cent, or NOK 3.6 billion from 2010 to 2011. As a whole, the turnover within retail trade increased by 3.8 per cent in the same period. The Index of retail sales showed a growth of 2.9 per cent, while the Wholesale and retail sale statistics showed a growth of 3.7 per cent. There was little change in the number of local KAUs and employed persons. Total turnover for the 37 170 units amounted to NOK 474.6 billion.
Continued growth for motor vehicles
The growth within trade and repair of motor vehicles continued in 2011, with a rise of 8.8 per cent from 2010. Also in 2011, the industry group sale of motor vehicles, with an increase of 9.9 per cent, corresponding to NOK 11.2 billion, made the largest contribution to the strong growth in the industry. With 67 per cent of the turnover, this is the largest industry group within trade and repair of motor vehicles, but the other industry groups also experienced a good year in 2011.
Another year with growth in wholesale trade
All industry groups within wholesale trade, except for two, experienced growth in 2011. The industry group Other specialised wholesale, where the sub-group Wholesale of solid , liquid and gaseous fuels and related products accounted for about 47 per cent of the turnover, continued its positive growth with an increase in turnover of 9.8 per cent from 2010 to 2011. The industry group Wholesale of machinery, equipment and supplies, which experienced a decline in the previous year, rose by 9.2 per cent.
Joint tables available in JuneOpen and readClose
Joint tables including all industry sections, divisions and groups will be available in Statbank on Friday 28 June at 10:00 am.
Enterprise statisticsOpen and readClose
The statistics is now published as Business statistics.
Additional information
The statistics have figures for both local KAUs and enterprises, but preliminary figures are published only on enterprise level.
The figures for enterprises will deviate from the figures for local KAUs. The reason is that enterprises that are registered with principal activity in one industry may have local KAUs with activities in other industries.
Read more in About the statistics .
Contact
-
Statistics Norway's Information Centre
E-mail: informasjon@ssb.no
tel.: (+47) 21 09 46 42


