Content
Published:
This is an archived release.
Growth for wholesale and retail trade in 2010
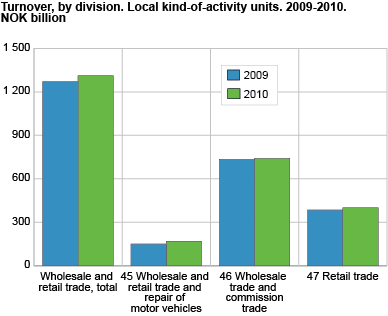
After a decline in turnover for trade industries in 2009, the turnover in 2010 increased by 3.2 per cent.
The total turnover in 2010 amounted to NOK 1 312 billion. Despite the increase from 2009 of 3.2 per cent, turnover was 1 per cent lower in 2010 than in 2008.
Fewer units and persons employed
The decrease in the number of local kind-of-activity units and employment continued in 2010, with a reduction in the number of companies from 2009 of 2.1 per cent, while employment declined by 0.2 per cent. Thus, there were 1 376 fewer units and 582 fewer persons employed in 2010 than in 2009. There were a total of 65 702 units and 368 837 employed persons within wholesale and retail trade ; repair of motor vehicles and motorcycles in 2010. Despite a slight decline in employment, labour costs increased by 2.2 per cent to NOK 131.5 billion. Gross investment rose by 9 per cent to NOK 8.3 billion in 2010. See also the quarterly investment statistics for retail trade.
Largest increase in Akershus, continued decline in Oslo
All counties except Oslo and Finnmark experienced growth in turnover from 2009 to 2010. In Oslo, the turnover decreased by NOK 3.1 billion, or 0.9 per cent, while it decreased by NOK 0.5 billion, or 4.5 per cent in Finnmark. Also in 2010, the county of Sogn og Fjordane saw the greatest increase in turnover from the previous year, with a growth of 8.7 per cent or NOK 1.8 billion. Troms was a close second, with an increase of 8 per cent, or NOK 2.6 billion. The county with the largest revenue increase in NOK was Akershus, with an increase of NOK 13 billion, equivalent to 6.4 per cent.
Fewer units and higher turnover for retail
While the number of businesses in the retail sector fell by 2.3 per cent, turnover in the industry increased by 3.5 per cent. The Index of retail sales shows a growth of 2.2 per cent, while the Wholesale and retail sale statistics show a growth of 3.2 per cent. The 37 380 units in the industry had a combined turnover of NOK 399.6 billion.
Large increase for motor vehicles
2010 was a good year for local kind-of-activity units engaged in the trade and repair of motor vehicles. With an increase of 13.1 per cent from 2009, the total turnover ended at NOK 170.1 billion. The industry group Sale of motor vehicles accounted for almost 67 per cent of turnover in the industry, and had an increase in turnover of 15.4 per cent from 2009.
A growth of 1 per cent for wholesale trade
As with the figures for 2009, there were also large variations in the development of turnover within wholesale trade in 2010. After a decline of 19.2 per cent from 2008 to 2009, the turnover for the industry group Other specialised wholesale increased by 8.4 per cent. Here we find Wholesale of solid , liquid and gaseous fuels and related products , which in 2010 accounted for nearly 46 per cent of the turnover in this industry group. Wholesale of machinery , equipment and supplies is one of the industry groups that pull in the opposite direction, with a decrease from 2009 of 5.7 per cent.
The nearly 19 200 local kind-of-activity units within wholesale trade had a combined turnover of NOK 742 billion; an increase of 1 per cent from 2009. Employment remained more or less stable from 2009 to 2010.
TurnoverTurnover in the structure statistics is excluding VAT. |
Enterprise statisticsThe structure statistics are published both at enterprise and local kind-of-activity unit level. The figures for enterprises will normally differ from the ones for local kind-of-activity units because enterprises registered according to main activity may have local KAUs with activity in other industries. For more information and further definitions, see About the statistics . |
Comparisons with other European countriesFor international comparisons, see EUROSTAT . |
Tables:
- Table 1 Principal figures, by industry group. Local kind-of-activity units. 2009 and 2010
- Table 2 Principal figures, by number of persons employed and industry group. Local kind-of-activity units. 2010
- Table 3 Principal figures for the industrial section by county. Local kind-of-activity units. 2010
- Table 4 Principal figures, by industry group. Enterprises. 2009 and 2010
- Table 5 Principal figures, by number of persons employed and industry group. Enterprises. 2010
The statistics is now published as Business statistics.
Additional information
The statistics have figures for both local KAUs and enterprises, but preliminary figures are published only on enterprise level.
The figures for enterprises will deviate from the figures for local KAUs. The reason is that enterprises that are registered with principal activity in one industry may have local KAUs with activities in other industries.
Read more in About the statistics .
Contact
-
Statistics Norway's Information Centre
E-mail: informasjon@ssb.no
tel.: (+47) 21 09 46 42


