Content
Published:
This is an archived release.
Retail sales amounted to NOK 225 billion
Retail sales except motor vehicles and motorcycles came to NOK 225 billion in 2002.
Only retail figures are included in this article and all figures are exclusive of VAT. Retail sales of motor vehicles, motorcycles and automotive fuel are not included.
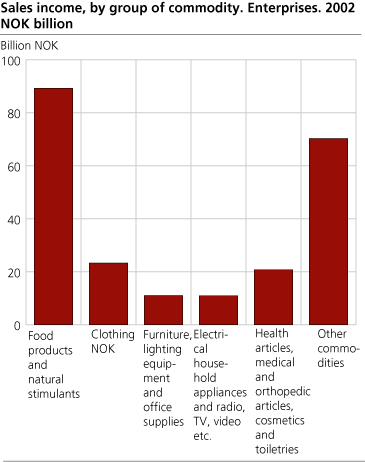
The retail industry sold food products and beverages for NOK 89.2 billion, or 39.6 per cent of total sales. Clothing amounted to NOK 23.3 billion, or 10.3 per cent. Health articles, medical and orthopaedic articles, cosmetics and toiletries amounted to NOK 20.7 billion, or 9.2 per cent.
Sales of furniture, lighting equipment and office supplies amounted to NOK 11 billion, whereas electrical household appliances and radio, TV, video came to NOK 10.9 billion. This is 4.9 and 4.8 per cent of total sales respectively.
Retail sales in non-specialized stores
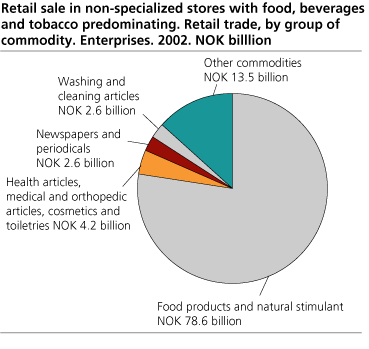
Retail sales in non-specialized stores selling mainly food, beverages and tobacco came to NOK 101.5 billion in 2002. Retail sales of food products and beverages came to NOK 78.6 billion, or 77.5 per cent. Sales of meat and meat products came to NOK 14.1 billion, whereas milk, cheese and eggs came to NOK 11 billion. This is 13.9 and 10.8 per cent of total retail sales respectively. Retail sales of tobacco products came to NOK 6.8 billion, while sales of alcoholic beverages and non-alcoholic beer amounted to NOK 6.1 billion. This is 6.7 and 6 per cent of total sales respectively. Retail sales of bread, cakes and flour confectionary totalled NOK 5.9 billion, or 5.8 per cent of total sales. Retail sales of vegetables amounted to NOK 5.3 billion, or 5.2 per cent, and the sale of fruits and berries amounted to NOK 4.1 billion, or 4.1 per cent. Sales of coffee, tea and cocoa amounted to NOK 2.1 billion, whereas other non-alcoholic beverages (mineral water, soft drinks, squash, juice etc.) came to NOK 4.8 billion. This is 2.1 and 4.7 per cent of total sales respectively.
The retail industry sold health articles, medical and orthopaedic articles, cosmetics and toiletries for NOK 4.2 billion, representing 4.1 per cent of total sales. The sale of perfume, cosmetics and toiletries amounted to NOK 3.8 billion, or 3.7 per cent of total sales. Sales of newspapers and periodicals came to NOK 2.6 billion, or 2.5 per cent, and washing and cleaning products came to NOK 2.6 billion, or 2.5 per cent.
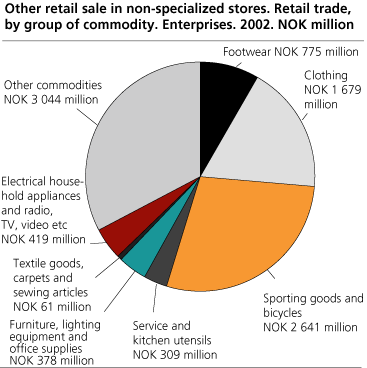
Retail sales in other non-specialized stores came to NOK 9.3 billion in 2002. The figure includes sporting goods (except clothing and footwear) and bicycles for NOK 2.6 billion and clothing and footwear for NOK 1.7 and 0.8 billion respectively. The figures represent 28.4, 18 and 8.3 per cent of total sales respectively.
Clothing and footwear
Total sales by enterprises involved in the retail sale of clothing came to NOK 21.1 billion in 2002. Clothing represented NOK 19.3 billion, or 91.3 per cent of total sales.
Total sales by enterprises involved in the retail sale of footwear came to NOK 2.8 billion. Footwear represented 99.4 per cent of total sales.
Furniture, lighting equipment and office supplies
Total sales by enterprises involved in the retail sale of furniture came to NOK 10.1 billion in 2002. Furniture, lighting equipment and office supplies represented NOK 8 billion, or 78.4 per cent of total sales.
Sales space and number of fixed market stands
Out of the 26 867 enterprises in the retail industry 17 390, or 64.7 per cent, had less than 120 square metres of sales space. Enterprises involved in retail sales not in store are not included in this figure. 6 080 enterprises, or 22.6 per cent, had sales space between 120 and 399 square metres, whereas 2 565 enterprises, or 9.5 per cent, had 400 to 999 square metres of sales space.
For the 5 422 enterprises in retail sale in non-specialized stores mainly selling food, beverages and tobacco, 2 796 enterprises, or 51.6 per cent, had sales space less than 120 square metres. 1 387 enterprises, or 25.6 per cent, had sales space between 120 and 399 square metres, while 957 enterprises, or 17.7 per cent, had sales space between 400 and 999 square metres.
The enterprises in retail sale via stalls and markets had 168 fixed market stands and/or stalls in 2002.
Tables:
- Table 1 Sales income, by group of commodity. Enterprises. 2002
- Table 2 Sales income, by industry subclass and group of commodity. Enterprises. 2002
- Table 3 The number of retail enterprises, by sales area and industry subclass. 2002
- Table 4 Specification of turnover by different industries and industry subclass, expressed in percentages. Enterprises. 2002
- Table 5 Repair of personal and household goods. Specification of turnover by industry subclass, expressed in percentages. Enterprises. 2002
The statistics is now published as Business statistics.
Contact
-
Stian Elisenberg
E-mail: stian.elisenberg@ssb.no
tel.: (+47) 40 81 14 65
-
Joel Parr
E-mail: joel.parr@ssb.no
tel.: (+47) 90 87 32 76


