Content
Published:
This is an archived release.
Wholesale sales amounted to NOK 440 billion
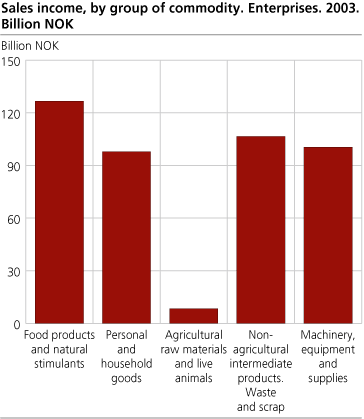
Wholesale sales except motor vehicles and motorcycles came to NOK 440 billion in 2003. The sale of food products and natural stimulants amounted to almost NOK 127 billion, of which sales of fish, shellfish and fish products amounted to NOK 39 billion.
Only wholesale figures are included in this article, and all figures are exclusive of VAT. Wholesale trade sales of motor vehicles and motorcycles are not included.
The wholesale industry sold food products and natural stimulants for NOK 126.7 billion, or 28.8 per cent of total sales in 2003. Personal and household goods amounted to NOK 97.9 billion, or 22.2 per cent. Non-agricultural intermediate products, waste and scrap amounted to NOK 106.6 billion, or 24.2 per cent.
The sales of machinery, equipment and supplies amounted to NOK 100.4 billion, whereas agricultural raw materials and live animals came to NOK 8.4 billion. This is 22.8 and 1.9 per cent of total sales respectively.
Sales of food products and natural stimulants by commodity group
Wholesale sales of food products and natural stimulants came to NOK 126.7 billion. Sales of fish, shellfish and fish products amounted to NOK 39.0 billion, and sales of dairy produce, cheese, eggs, oil and fat came to NOK 17.2 billion. This is 8.9 and 3.9 per cent of total wholesale sales respectively. Sales of fruits, berries, nuts and vegetables amounted to NOK 13.6 billion, whereas meat and meat products came to NOK 12.3 billion. Sales of alcoholic and non-alcoholic beverages came to NOK 11.9 billion.
Sales of other products by commodity group
The wholesale industry sold fuels for NOK 41.4 billion, representing 9.4 per cent of total sales, whereas the sale of timber, lumber and a variety of construction materials amounted to NOK 30.1 billion, or 6.8 per cent of total sales. Sales of pharmaceutical goods, surgical and orthopaedic instruments came to NOK 27.0 billion, whereas sales of computers and computer equipment (incl. software) came to NOK 23.6 billion. The figures represent 6.1 and 5.4 per cent of total sales respectively. Sales of hardware, plumbing and heating equipment and supplies, and hand tools came to NOK 14.0 billion, or 3.2 per cent. Sales of clothing and shoes came to NOK 12.6 billion, whereas sales of perfume, cosmetics and toilet requisites (including toilet paper, sanitary napkins and nappies) amounted to NOK 10.4 billion. The figures represent 2.9 and 2.4 per cent of total sales respectively.
Non-specialized wholesale of food, beverages and tobacco
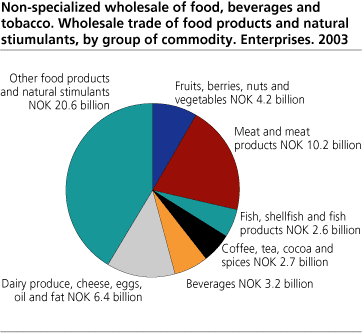
Wholesale sales in non-specialized stores selling food, beverages and tobacco came to NOK 61.8 billion in 2003. Wholesale sales of food products and natural stimulants amounted to NOK 49.9 billion, or 80.7 per cent of total sales. Wholesale sales of meat and meat products came to NOK 10.2 billion, whereas sales of dairy produce, cheese, eggs, oil and fat came to NOK 6.4 billion. This is 16.6 and 10.3 per cent of total sales respectively. Sales of fruits, berries, nuts and vegetables amounted to NOK 4.2 billion, whereas sales of alcoholic and non-alcoholic beverages came to NOK 3.2 billion. The figures represent 6.8 and 5.1 per cent of total sales respectively. Sales of coffee, tea, cocoa and spices amounted to NOK 2.7 billion, whereas sales of fish, shellfish and fish products came to NOK 2.6 billion.
Sale of perfume, cosmetics and toilet requisites (including toilet paper, sanitary napkins and nappies) amounted to NOK 4.0 billion, or 6.5 per cent, whereas sales of kitchen utensils, wallpaper and cleaning materials came to NOK 1.8 billion, and electrical household appliances and radio, TV, video etc amounted to NOK 1.0 billion.
NOK 3.9 billion in agency trade
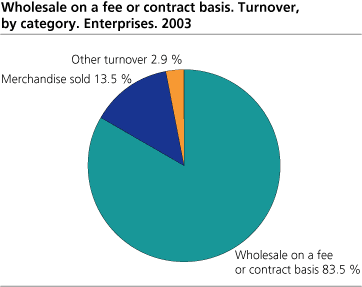
Enterprises involved in agency trade had a turnover of NOK 3.9 billion in 2003. Wholesale on a fee or contract basis amounted to NOK 3.3 billion, or 83.5 per cent. Turnover from merchandise sold came to NOK 531 million, whereas other turnover was NOK 116 million.
Tables:
- Table 1 Sales income, by group of commodity. Enterprises. 2003
- Table 2 Sales income, by industry subclass and group of commodity. Enterprises. 2003
- Table 3 Specification of turnover by different industries and industry subclass, expressed in percentages. Enterprises. 2003
- Table 4 Wholesale on a fee or contract basis. Specification of turnover by industry subclass, expressed in percentages. Enterprises. 2003
The statistics is now published as Business statistics.
Contact
-
Stian Elisenberg
E-mail: stian.elisenberg@ssb.no
tel.: (+47) 40 81 14 65
-
Joel Parr
E-mail: joel.parr@ssb.no
tel.: (+47) 90 87 32 76


