Content
Published:
This is an archived release.
Food, beverages and tobacco taking a bigger piece of the pie
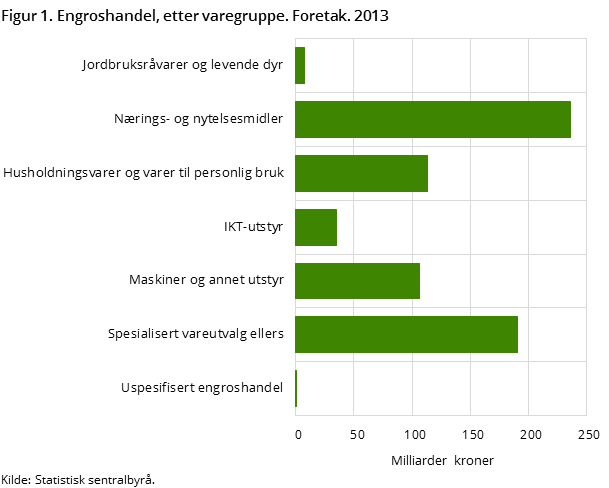
Sales of food, beverages and tobacco accounted for 34 per cent of the total wholesale trade in 2013. In 2008, this share was 29 per cent. Sales of these goods have increased compared to sales of other goods within the wholesale trade.
| 46 Wholesale trade, except of motor vehicles and motorcycles | 2013 | |
|---|---|---|
| Turnover (NOK mill)1 | Turnover (per cent) | |
| 1VAT is not included. | ||
| Turnover, total (mill. NOK) | 794 255.3 | 100.0 |
| 46.2-46.9 Total wholesale trade services, except of motor vehicles and motorcycles | 688 652.8 | 86.7 |
| 46.2 Wholesale trade services of agricultural raw materials and live animals | 7 312.6 | 0.9 |
| 46.3 Wholesale trade services of food, beverages and tobacco | 236 387.8 | 29.8 |
| 46.4 Wholesale trade services of household goods | 112 962.0 | 14.2 |
| 46.5 Wholesale trade services of information and communication equipment | 34 736.5 | 4.4 |
| 46.6 Wholesale trade services of other machinery, equipment and supplies | 106 346.6 | 13.4 |
| 46.7 Other specialised wholesale trade services | 190 851.4 | 24.0 |
| 46.9 Non-specialised wholesale trade services | 55.6 | 0.0 |
| 45.1_45.3 Wholesale and retail trade of motor vehicles, parts and accessories | 551.5 | 0.1 |
| 47 Retail trade services, except of motor vehicles and motorcycles | 19 622.4 | 2.5 |
| Other turnover | 85 428.6 | 10.8 |


Enterprises within the wholesale trade had a combined turnover of NOK 794 billion in 2013. Approximately 87 per cent were wholesale trade, and more than 34 per cent of this again was the sale of food, beverages and tobacco.
More fish, crustaceans and molluscs
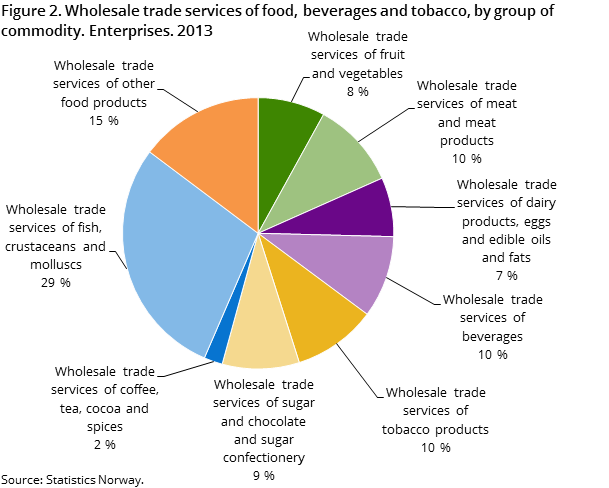
The wholesale trade sold food, beverages and tobacco for NOK 236 billion in 2013. This accounted for more than 34 per cent of the total wholesale trade. In 2008, which was the last time a similar product distribution survey was conducted, the proportion of food, beverages and tobacco within the wholesale trade was just over 29 per cent. Accordingly, sales of food, beverages and tobacco have increased more than sales of other products in the period 2008 to 2013.
A product group that experienced a large increase in turnover from 2008 to 2013 was fish, shellfish and molluscs. Wholesale sales of such products amounted to almost NOK 68 billion in 2013 and accounted for nearly 29 per cent of the total sales of food, beverages and tobacco. By comparison, this share was 25 per cent in 2008.
The product group within sales of food, beverages and tobacco that had the highest increase in the period, was tobacco. The increase was 63 per cent, from NOK 14 billion in 2008 to NOK 23 billion in 2013. Sales accounted for 10 per cent of total sales of food, beverages and tobacco in the wholesale trade in 2013. In 2008, this share was slightly over 7 per cent.
At the same time, the share of fruits and vegetables fell from 10 per cent in 2008 to 8 per cent in 2013.
More clothing and footwear
Wholesale of clothing and footwear increased from NOK 14 billion in 2008 to over NOK 17 billion in 2013; an increase of almost 25 per cent. The proportion of clothing and footwear compared to other household goods increased from around 12 per cent in 2008 to over 15 per cent in 2013.
With a share of 29 per cent, pharmaceutical goods were the largest product group within household goods. Wholesale sales increased by 19 per cent, from NOK 27 billion in 2008 to almost NOK 33 billion in 2013.
Despite the fact that these two product groups increased from 2008 to 2013, wholesale sales of household goods overall declined by 5 per cent, from NOK 119 billion in 2008 to NOK 113 billion in 2013. The reason was a decline in most other product groups within this.
The statistics is now published as Business statistics.
Contact
-
Stian Elisenberg
E-mail: stian.elisenberg@ssb.no
tel.: (+47) 40 81 14 65
-
Joel Parr
E-mail: joel.parr@ssb.no
tel.: (+47) 90 87 32 76
