Strong growth in consumption from foreign tourists
Publisert:
Foreign tourists’ consumption in Norway amounted to NOK 50 billion in 2016. This contributed strongly towards a good year for the tourism industries.
- Full set of figures
- Tourism satellite accounts
- Series archive
- Tourism satellite accounts (archive)
Total tourism consumption is estimated at NOK 170 billion in 2016, according to the latest results from the Tourism satellite accounts. Measured in volume, the consumption of foreign tourists increased by 7.4 per cent from 2015 to 2016. This was the second consecutive year with significant growth, and the total growth for the two years was over 17 per cent. Norwegian tourists experienced moderate growth in tourism consumption from the previous year; 1.8 per cent for households and 1 per cent for business travellers.
All 2016 results are preliminary.
Figure 1. Annual volume change of the tourism consumption
| 2008 | 2009 | 2010 | 2011 | 2012 | 2013 | 2014 | 2015 | 2016* | |
| Total | 0.4 | -4.0 | 2.8 | 3.1 | 4.7 | 3.5 | 2.1 | 2.1 | 3.3 |
| Non-residents | -2.3 | -4.7 | 6.6 | 4.3 | 4.6 | 2.5 | 4.4 | 9.0 | 7.4 |
| Resident households | 2.2 | -1.8 | 2.4 | 1.8 | 5.9 | 5.7 | 1.1 | 0.9 | 1.8 |
| Resident industries | -0.9 | -9.6 | -1.4 | 5.7 | 0.6 | -2.7 | 1.8 | -5.2 | 1.0 |
Highest consumption in accommodation and food
Half of foreign tourists’ consumption was spent on the tourism products accommodation and food serving services as well as transport services. Every NOK 3 of NOK 10 was spent on the former, and NOK 2 of NOK 10 on the latter. The consumption of accommodation and food serving services increased more than that of transport services. According to Anne Mari Auno, senior adviser at Statistics Norway’s unit for National accounts statistics, this is partly due to the fact that foreign carriers are often used when travelling to Norway, and their income does not benefit the Norwegian economy.
Accommodation services cover stays at commercial establishments. Expenses towards renting private homes, holiday homes and rooms are mostly included in the housing consumption, and therefore counted as consumption of non-characteristic products in the satellite accounts. There has been a change in recent years in how these are marketed, but the impact of the sharing economy is still limited.
1 in 10 jobs in tourism
There were 162 400 FTEs (employment measured in full-time equivalents) in the tourism industries in 2016. This is a growth of 11 000 FTEs since 2011. The corresponding growth for mainland Norway was 113 800 FTEs.
The increase in the tourism industries stems mainly from accommodation and food serving services, where 9 000 new FTEs were added from 2011 to 2016. In 2016, these two industries had almost 74 000 FTEs.
Figure 2. Employees and self-employed in tourism industry. 2016*
| 1 000 full-time equivalent persons | |
| Rail transport | 4.5 |
| Travel agency and tour operator reservation services | 5.5 |
| Air transport | 6.9 |
| Rental and leasing activities | 6.9 |
| Sport and other recreation activities | 7.2 |
| Water transport | 10.2 |
| Cultural activities | 18.1 |
| Accommodation services | 25.6 |
| Road transport | 29.6 |
| Food and beverage service activities | 48.0 |
Strongest growth in output in the tourism industries
The output in the tourism industries is estimated at NOK 280 billion in 2016. This is higher than 12 per cent growth in volume from 2011 to 2016. In comparison, the output growth in mainland Norway was 9 per cent in the same period.
The tourism industries’ share of the total output in mainland Norway was 6 per cent in 2016.
The value added in the tourism industries is estimated at almost NOK 114 billion in 2016. The tourism industries’ share of the total value added in mainland Norway was 4.2 per cent. This share has remained stable for a number of years.
Oslo and Akershus dominate
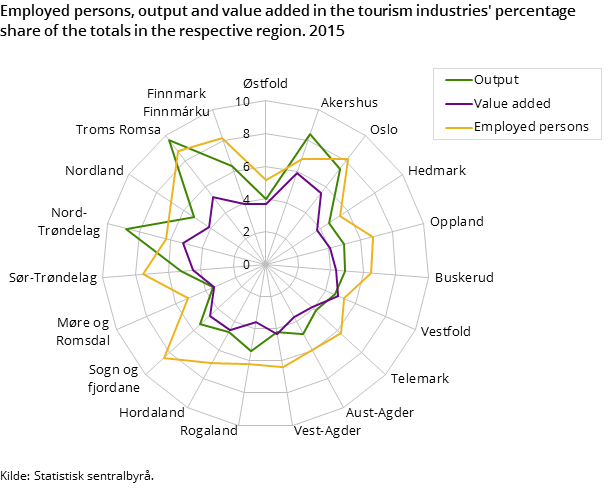
Oslo and Akershus, the capital county and the neighbouring county, were the counties with the highest activity level in the tourism industries in 2015. About 40 per cent of the output and value added in the tourism industries was generated here.
The tourism industries constituted 8 per cent of total output and 6 per cent of total value added in these two counties.
Kontakt
-
Anne Mari Auno
-
SSBs informasjonstjeneste

