Content
Published:
This is an archived release.
Fewer marriages, but more marriages abroad
A total of 23 1001 couples were married in 2011. About 5 000 couples got married abroad; 200 more than in 2010. A total of 10 200 couples divorced and 11 200 separated. Compared to 2010, there were 450 fewer marriages, almost as many divorces and 500 fewer separations.
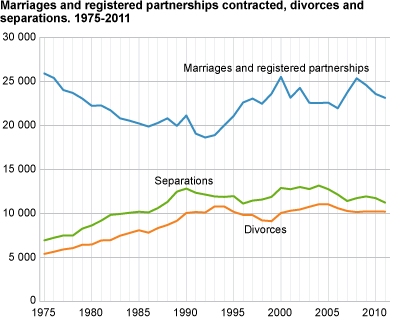
Steadily more people are preferring to get married abroad. At the end of the 80s, about 1 000, or five per cent of the 20 000 marriages held each year took place abroad. Since then, the percentage of couples getting married abroad has increased; to 22 per cent in 2011. The number of divorces has remained unchanged for the last five years.
Constant marriage rates
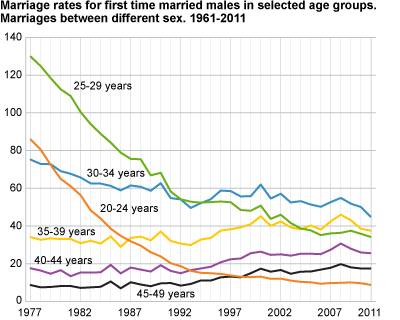
The average age for first time married males was 34.0 years and 31.1 years for females. After an increase until 2008, the mean age has changed very little for both sexes. Since the lowest level in 1970, the mean age for first time married has increased by 8.9 years for males and 8.3 years for females.
Still most common to get married in the age group 30-34
The marriage rate for first time married was highest for both males and females in the age group 30-34 years, as in previous years. From 2010 to 2011, the rate decreased for females below 40, but increased little for those who were older. From 2008, the marriage rate decreased for males and females in all age groups. The decrease was largest for females aged 25-29 and for males aged 30-34, and half of this took place between 2010 and 2011.
Most marriages during the summer months
About half of all marriages took place during the summer months, followed by the autumn and spring months. Fewest marriages took place in the winter months.
Unchanged number for divorces
The number of divorces has remained roughly unchanged over the last five years, with about 10 200 yearly. The divorce rate was highest for males aged 45-49 years, and for females aged 40-44 years. Before 2010, the divorce rate was highest in the age group below, while before that most divorces were among the younger age groups. This development is due to an increase in the marriage age among first time married after 1970, and the fact that more people are marrying more than once. More marriages were postponed due to living together early in the cohabitation. While 89 per cent of all marriages were between earlier unmarried in the last of the 60s, the corresponding percentage in 2005 was 702.
The marriages of couples divorcing in 2011 had lasted an average of 13.0 years. This average has been between 12.9 and 13.2 years over the last five years.
|
On 1 January 2009, the Marriage Act was changed to allow two persons of the same sex to marry, and made it no longer possible to contract a partnership. Persons already in a partnership can change their partnership to a marriage. |
Of the 23 100 marriages in 2011, 259 couples were of the same sex; 93 male couples and 166 female couples. This is almost as many as the year before.
In 2011, 56 partnerships were dissolved by separation and 54 partnerships were dissolved by divorce. At the beginning of 2012, there were 2 094 existing partnerships.
1Corrected Tuesday 25th September 2012: "A total of 23 600" to "A total of 23 100"
2Corrected Tuesday 25th September 2012: "While 89 per cent of all marriages were not a first marriage at the end of the 60s, the corresponding percentage in 2005 was 70." to "While 89 per cent of all marriages were between earlier unmarried in the last of the 60s, the corresponding percentage in 2005 was 70."
Tables:
- Table 1 Marriages, by county. 1966-2011
- Table 2 Divorces and separations. County. 1981-2011
- Table 3 Marriages contracted. Marriages between persons of opposite sex. 1950-2011
- Table 4 Marriages contracted, by type of marriage. 1961-2011
- Table 5 Marriages. Marriages between persons of opposite sex , by previous marital status of the spouses. 1961-2011
- Table 6 Average age at marriage. Marriages between persons of opposite sex. Males and females. 1961-2011
- Table 7 Marriage rates for first time married males and females in selected age groups. Marriages between persons with opposite sex. 1961-2011
- Table 8 Marriages dissolved. Separations. 1961-2011
- Table 9 Divorce rates for males and females in various age groups. Divorces between persons with opposite sex. 1959-2011
- Table 10 Number of children involved in divorces. Divorces between persons with opposite sex. 1971-2011
- Table 11 Divorces, by number of common children and duration of marriage. Divorces between persons of opposite sex. 2011
- Table 12 Estimated percentage of marriages dissolved, assuming the divorce rates as in the year of observation. 1960-2011
- Table 13 Separation rates for males and females in variaous age groups. Separations between persons with opposite sex. 1999-2011
- Table 14 Number of children involved in separations. Separations between persons with opposite sex. 1999-2011
- Table 15 Separations, by number of children and duration of marriage. Separations between persons with opposite sex. 2011
Contact
-
Anders Sønstebø
E-mail: anders.sonstebo@ssb.no
tel.: (+47) 46 66 37 74
-
Ane Margrete Tømmerås
E-mail: ane.tommeras@ssb.no
tel.: (+47) 91 99 29 62
-
Espen Andersen
E-mail: espen.andersen@ssb.no
tel.: (+47) 92 61 00 46
-
Statistics Norway's Information Centre
E-mail: informasjon@ssb.no
tel.: (+47) 21 09 46 42
-
Oppdrag befolkningsstatistikk
E-mail: befolkning@ssb.no