Content
Published:
This is an archived release.
NOK 40 billion in public funding to non-profit institutions
The satellite account now includes, for the first time, the funding of non-profit institutions’ activities. The estimations show that approximately 43 per cent of the organisations’ operating income came from the public sector. The value added in non-profit institutions is estimated to have contributed to 2.1 per cent of the GDP for Mainland Norway in 2012, and employed more than 83 000 full-time equivalents (FTEs).
| 2010 | 2011 | 2012 | |
|---|---|---|---|
| Output. NOK million | 81 663 | 86 821 | 90 510 |
| Value added. NOK million | 42 125 | 45 890 | 47 674 |
| Full-time equivalent persons (paid employees) | 80 396 | 82 679 | 83 254 |
| Percentage of GDP | |||
| Value added as share of GDP. Percentage | 1.6 | 1.6 | 1.6 |
| Value added as share of GDP Mainland Norway. Percentage | 2.0 | 2.1 | 2.1 |
| Full-time equivalent persons (paid employees) as share of total full-time equivalent persons in Norway. Percentage | 3.5 | 3.6 | 3.5 |
| Sources of income for non-profit institutions | |||
| Central government’s share of total funding. Percentage | 25.9 | 25.8 | |
| Local/municipal governments’ share of total funding. Percentage | 17.4 | 17.5 | |
| Households’ share of total funding. Percentage | 39.0 | 38.5 | |
| Other sources of funding. Share of total funding. Percentage | 17.7 | 18.2 |


The non-profit institutions are estimated to have contributed NOK 47.7 billion to the gross domestic product (GDP) in 2012; an increase of NOK 5 billion from 2010. There were just over 83 200 paid FTEs in the sector as a whole, constituting around 3.5 per cent of FTEs in Norway overall. For previous years, this satellite account has included an estimate of the value added in non-profit institutions where the value of the volunteer (unpaid) work has been taken into account. However, subject to a new study on the amount of volunteer work this estimate has not been calculated for 2011 and 2012. Previous calculations have shown a ratio of 1.4 volunteers for every paid FTE. This ratio would constitute around 120 000 FTE volunteers in 2012 - about half of which are within culture and recreation.
Health and social services account for 37 per cent of the value added in non-profit institutions
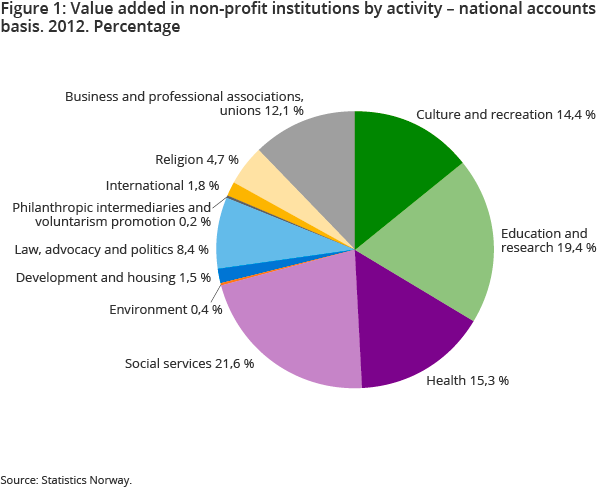
The non-profit sector consists of institutions of different sizes and activities. From small, local associations to large international organisations they are involved in a wide array of activities, performing important tasks in the Norwegian welfare society. It is mainly the same activities that contribute the most to the GDP in 2012 as in previous years. Health and social services, along with education and research, contributed about 56 per cent of the total value added in the non-profit sector. Institutions in the area of culture and recreation contributed just over 14 percent, while institutions within the other activities contributed approximately 29 per cent in total.
Public sector contributions constituted about 40 per cent of the institutions’ operating income
For the first time, this satellite account now includes an overview of the non-profit institutions’ income structure. Organisations in the non-profit sector finance their activities through several different channels, from sale of services to public and private participants, government transfers, membership payments, sponsors, gifts, collections and more. The calculations in this satellite account are intended to show how the organisations finance their operations. Funds for investment purposes are therefore excluded from this framework.
Central and local government contributed around 26 and 18 per cent of the organisations’ total operating incomes, respectively, or almost 40 NOK billion in total. The contributions from households are estimated to have been almost NOK 35 billion, roughly 38 per cent, while the rest of the operating income was funded by the corporate sector (approximately 18 per cent).
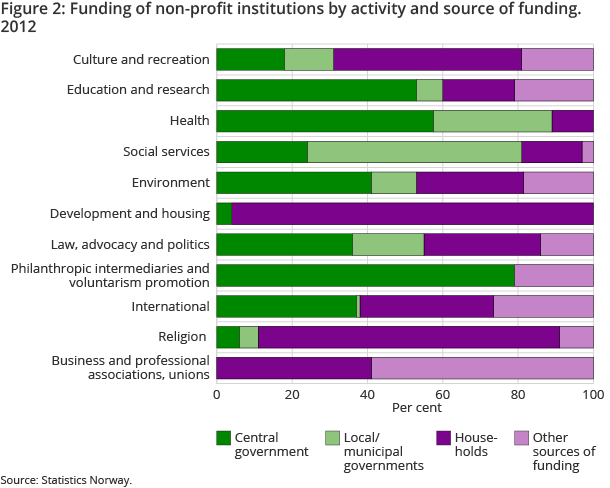
Figure 2 shows how organisations working within the different activities fund their operations, and illustrates the differences in income structure among the non-profit institutions. While the organisations working within health, social services and education and research activities receive most of their funding from public sector contributions, the figures show that households and the corporate sector are important contributors for organisations within many of the activity categories. For instance, households contributed about half of the operating income for organisations within culture and recreation.
Public sector contributions directed towards health, social services and education and research
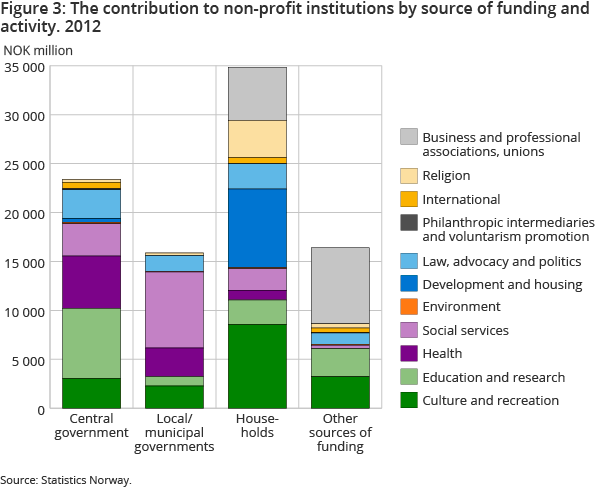
Organisations within these three activities received almost 70 per cent of the public sector contributions to non-profit institutions in 2012, or approximately NOK 27.5 billion. Figure 3 shows how the contributions from central and local government, households and other sources are divided between organisations within the different activities. A large portion of the funds from central government is directed towards health and education and research, while social services account for almost half of the contributions from local government. Culture and recreation, along with development and housing, receive almost 50 per cent of the contributions from households, while religious organisations and employee unions also receive a good portion of the households’ contributions. Other sources of funding consist mainly of participants in the corporate sector, and almost half of their contributions is directed towards business and professional associations.
Contact
-
Sindre Midttun
E-mail: sindre.midttun@ssb.no
tel.: (+47) 41 62 78 05
-
Nils Amdal
E-mail: nils.amdal@ssb.no
tel.: (+47) 91 14 91 46
