Content
Published:
This is an archived release.
Sharp decline in petroleum revenues
General government surplus is estimated at NOK 180 billion in 2015. Due to a substantial decrease in petroleum revenues, this is close to NOK 100 billion lower than the previous year.
| 2011 | 2012 | 2013 | 2014 | 2015 | |
|---|---|---|---|---|---|
| General government revenue | 1 580 595 | 1 664 677 | 1 662 578 | 1 691 864 | 1 678 239 |
| General government expenditure | 1 205 122 | 1 254 127 | 1 331 246 | 1 416 584 | 1 498 669 |
| Net lending/borrowing (-) | 375 474 | 410 551 | 331 332 | 275 280 | 179 570 |
| Central government net lending/borrowing | 394 979 | 427 676 | 354 512 | 298 629 | 201 527 |
| Local government net lending/borrowing | -19 505 | -17 126 | -23 180 | -23 349 | -21 958 |
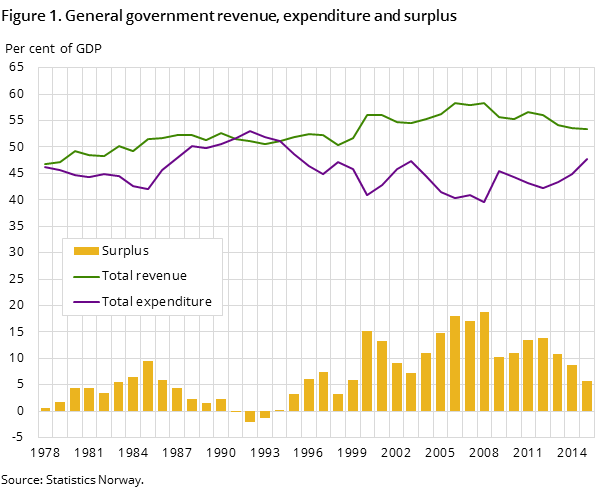
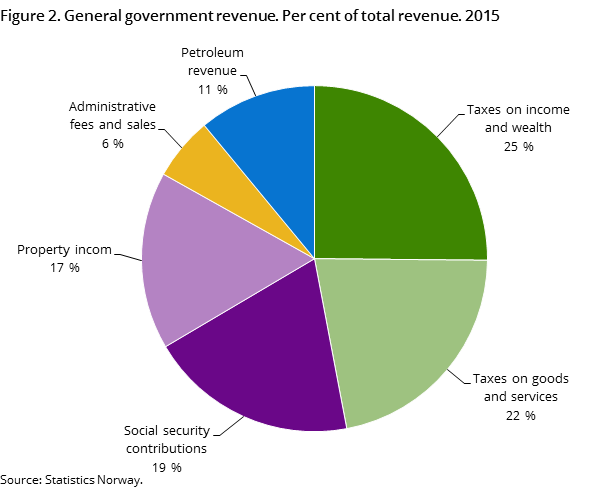
Petroleum revenues totalled NOK 184 billion in 2015, according to preliminary figures. This is more than 100 billion lower than in 2014 – and can be attributed to decreased taxes from companies engaged in petroleum extraction. Petroleum taxes dropped from NOK 146 billion in 2014 to NOK 75 billion in 2015 – a decrease of almost 50 per cent. This is mainly explained by falling oil prices in recent years.
Growth in property income and taxes from Mainland Norway
General government revenue excluding petroleum is calculated at slightly less than NOK 1 500 billion in 2015 – an increase of almost 7 per cent from 2014. Income from interest and dividends in the Government Pension Fund Global, as well as taxes from households and companies in Mainland Norway, were contributing factors to this.
Increased benefits to disabled and unemployed persons
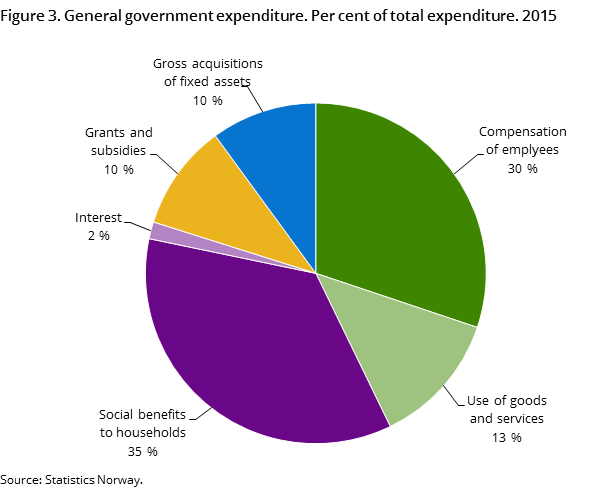
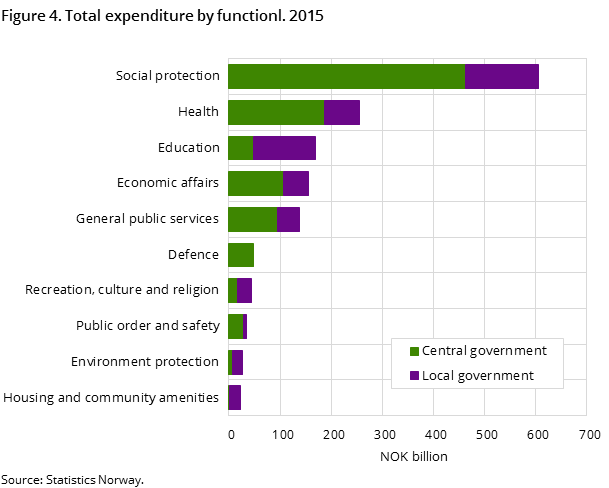
General government’s social benefits to households amounted to approximately NOK 460 billion in 2015 – which corresponds to an increase of 7 per cent from 2014. The increase can partly be explained by the fact that new regulations regarding disability pensions were introduced in 2015. Compared to the previous regime, a larger portion of the disability benefits is now subject to income taxation. To compensate for this, the gross disability benefits were adjusted upwards, in order for the net benefits (gross benefits less taxes) to remain the same as before 2015.
In addition, unemployment benefits have risen as a consequence of the increasing number of unemployed persons in Norway.
Prolonged deficit in the local government sector
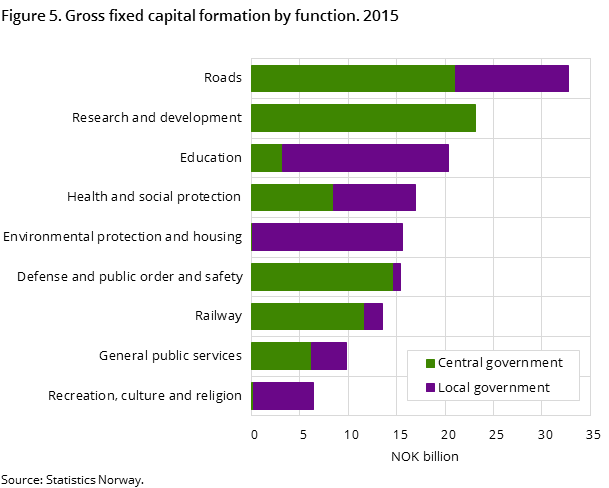
In 2015, revenues rose slightly more than expenditures in the local government sector, compared to the previous year. Preliminary figures indicate a deficit of NOK 22 billion in 2015, according to book values. This is the ninth year in a row with local government deficit in excess of NOK 10 billion. Considerable growth in expenditure related to fixed capital formation has contributed to the prolonged deficit.
New quarterly figures for general governmentOpen and readClose
From this release onwards, quarterly general government revenue and expenditure are available. Figures are based on collected accounts for large parts of the central and local government, in addition to estimations made in the quarterly national accounts. Quarterly data are consistent with annual data.
Data and uncertaintyOpen and readClose
The published figures are based on preliminary accounts for central government, municipalities and county authorities. There is considerable uncertainty regarding these figures and they should be used with caution.
This page has been discontinued, see General government revenue and expenditure, Quarterly.
Contact
-
Eivind Andreas Sirnæs Egge
E-mail: eivind.egge@ssb.no
tel.: (+47) 91 69 05 03
-
Frode Borgås
E-mail: frode.borgas@ssb.no
tel.: (+47) 40 90 26 52
-
Aina Johansen
E-mail: aina.johansen@ssb.no
tel.: (+47) 40 90 26 66
