Content
Published:
This is an archived release.
Growth in health and social services
Preliminary figures for activities in local government for the 4th quarter of 2010 show a growth in number of employees of 1.3 per cent, or close to 6 500 persons, compared to 2009.
Of the more than 495 000 employees in local government, 448 000 were employed by the municipalities and 47 000 were employed by the counties.
| Total, municipalities and counties | 2005 | 2006 | 2007 | 2008 | 2009 | 2010 | Change 2009-2010 | Percentage change 2009-2010 | |||||||||||||||||||||||||||||||||||||||||||||||||||||||||||||||||||||||
|---|---|---|---|---|---|---|---|---|---|---|---|---|---|---|---|---|---|---|---|---|---|---|---|---|---|---|---|---|---|---|---|---|---|---|---|---|---|---|---|---|---|---|---|---|---|---|---|---|---|---|---|---|---|---|---|---|---|---|---|---|---|---|---|---|---|---|---|---|---|---|---|---|---|---|---|---|---|---|---|
| Employed | 450 564 | 456 312 | 472 461 | 479 300 | 488 684 | 495 137 | 6 453 | 1.3 | |||||||||||||||||||||||||||||||||||||||||||||||||||||||||||||||||||||||
| Contracted man-years | 340 846 | 350 886 | 364 066 | 373 745 | 380 902 | 387 127 | 6 225 | 1.6 | |||||||||||||||||||||||||||||||||||||||||||||||||||||||||||||||||||||||
| Contracted man-years adjusted for sick-leave and maternity leave | 308 599 | 317 620 | 329 579 | 338 646 | 342 988 | 352 360 | 9 371 | 2.7 | |||||||||||||||||||||||||||||||||||||||||||||||||||||||||||||||||||||||
| Of which | |||||||||||||||||||||||||||||||||||||||||||||||||||||||||||||||||||||||||||||||
| Municipality, total | |||||||||||||||||||||||||||||||||||||||||||||||||||||||||||||||||||||||||||||||
| Employed | 406 789 | 411 396 | 426 152 | 433 600 | 441 899 | 447 863 | 5 964 | 1.3 | |||||||||||||||||||||||||||||||||||||||||||||||||||||||||||||||||||||||
| Contracted man-years | 303 371 | 312 249 | 324 611 | 334 178 | 340 287 | 345 881 | 5 593 | 1.6 | |||||||||||||||||||||||||||||||||||||||||||||||||||||||||||||||||||||||
| Contracted man-years adjusted for sick-leave and maternity leave | 273 616 | 281 527 | 292 706 | 301 735 | 305 348 | 313 749 | 8 401 | 2.8 | |||||||||||||||||||||||||||||||||||||||||||||||||||||||||||||||||||||||
| County, total | |||||||||||||||||||||||||||||||||||||||||||||||||||||||||||||||||||||||||||||||
| Employed | 43 775 | 44 916 | 46 309 | 45 700 | 46 785 | 47 274 | 489 | 1.0 | |||||||||||||||||||||||||||||||||||||||||||||||||||||||||||||||||||||||
| Contracted man-years | 37 475 | 38 637 | 39 456 | 39 567 | 40 615 | 41 247 | 632 | 1.6 | |||||||||||||||||||||||||||||||||||||||||||||||||||||||||||||||||||||||
| Contracted man-years adjusted for sick-leave and maternity leave | 34 983 | 36 093 | 36 873 | 36 910 | 37 640 | 38 611 | 971 | 2.6 | |||||||||||||||||||||||||||||||||||||||||||||||||||||||||||||||||||||||
| 1 | The figures for Oslo municipality are included in the county-figures for upper secondary school only. |
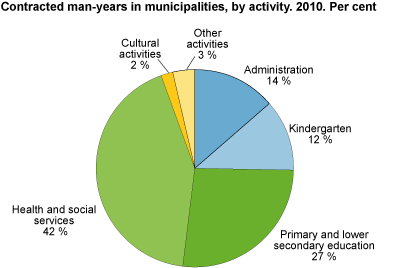
The number of employees in the municipalities increased by nearly 6 000 persons compared to the figures for the 4th quarter of 2009. Due to a high degree of part-time working employees, this amounts to 346 000 contracted man-years. The total growth in contracted man-years was 1.6 per cent from 2009 to 2010.
Man-years in health and social services amount to 42 per cent of the total man-years in the municipalities. The number of personnel in kindergartens has had a steady growth over the last 5 years, but slowed down in 2010 as most municipalities now fulfil the official requirement of day-care-spaces for all children between the ages of 1 and 6 years.
Increased number of man-years within nursing and care services
The growth in contracted man-years in nursing and care services was 2.7 per cent, or 3 300 contracted man-years, compared to 2009. The preceding two years show a growth of 1.9 and 2.6 per cent respectively. More than two thirds of the man-years were carried out by personnel with a health care education.
The figures for the nursing and care services also include private enterprises contracted by the municipalities. The man-years in private services amount to 6.7 per cent of the man-years in nursing and care services in total.
Stabile situation in the county authorities
A total of 47 000 were employed in the county authorities in 2010. Compared to 2009 this is an increase of 1.6 per cent or 630 man-years.
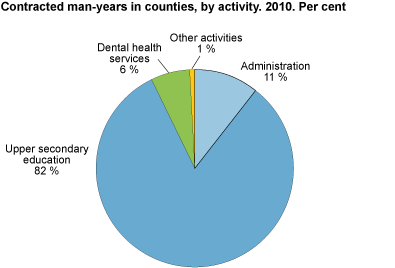
Upper secondary education amounts to a total of 82 per cent of the contracted man-years in the counties. The man-years in the county dental health services amount to 6 per cent. The distribution among the areas of responsibility for the counties has been largely unchanged over the last 5 years.
Tables:
The statistics is now published as KOSTRA.
This page has been discontinued, see Employment in municipal activities, Annually.
Contact
-
Statistics Norway's Information Centre
E-mail: informasjon@ssb.no
tel.: (+47) 21 09 46 42


