Content
Published:
This is an archived release.
Decrease in sickness absence
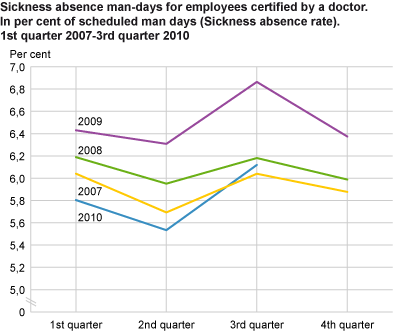
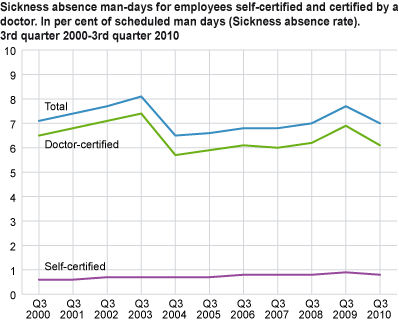
Sickness absence fell from 7.7 to 7 per cent from the third quarter of 2009 to the third quarter of 2010; a decrease of 9.9 per cent. This decrease may well be caused by a high level of sickness absence in 2009 due to the swine flu in 2009.
Adjusted for the swine flu in the third quarter of 2009, a rough estimate would be that the sickness absence would have decreased by 7 per cent instead of 9.9 per cent.
Effects of swine flu
The decrease in the diagnosis group "Sickness in the bronchiae", which among other diagnoses also includes influenza, explains about 22 per cent of the decrease in the doctor-certified sickness absence man-days. We do not have information about diagnoses in the self-certified sickness absence, but if we assume that all the reduction is caused by the swine flu, then about 25 per cent of the decrease in the sickness absence man-days is caused by the flu.
Absences caused by the flu are of quite short duration and will influence the number of sickness absence cases more than the sickness absence man-days during a quarter. If we take the decrease in the number if cases, and assume, as above, that the whole decrease in the self-certified sickness absence incidents is caused by the flu, then a total of 58 per cent of the decrease in the sickness absence cases is caused by the flu.
Statistics Norway does not have tables divided into different diagnosis groups, since we do not have access to this kind of data. We therefore refer to The Norwegian Labour and Welfare Administration .
The effect of the swine flu is difficult to estimate in different groups, such as sex, industry etc. When we, from now on, make comments on the figures, we do not take the flu into consideration, nor do we try to adjust the figures. In spite of this, we still get a clear decrease in the sickness absence in most of the groups.
Sickness absence in the third quarter of 2010 was 6.6 per cent lower than in the third quarter of 2001, the year of implementation of the agreement on an inclusive labour market.
Strongest reduction in doctor-certified sickness absence
Doctor-certified sickness absence fell from 6.9 to 6.1 per cent from the third quarter of 2009 to the third quarter of 2010; a reduction of 10.9 per cent. Self-certified sickness absence was reduced from 0.9 to 0.8 per cent; a reduction of 2 per cent.
Sickness absence for men decreased from 6.4 to 5.6 per cent, and for women it fell from 9.4 to 8.6 per cent. This equals a percentual drop of 11.5 and 8.3 per cent respectively.
Major reduction in accommodation and food service activities
All of the industries showed a decrease in sickness absence from the third quarter of 2009 to the third quarter of 2010. Among the major industries, the decline was greatest in the accommodation and food service industry and the construction industry, by 14.8 and 14.6 per cent respectively. Public administration had the smallest decline, by 5.7 per cent.
Private sector had the strongest decrease
Sickness absence in the private sector had the strongest reduction by 10.6 per cent. The absences in central government (including health enterprises) and local government were reduced by 8.7 and 8.2 per cent respectively.
Within central government, sickness absence in education (universities and university colleges) was reduced by 10.1 per cent, while falling by 9.6 per cent in health care (mainly health enterprises). Within local government, there was also a reduction in education (primary and secondary education) by 12.1 per cent, while the sickness absence in health care was reduced by 8.5 per cent.
The sickness absence was lowest in the private sector with 6.6 per cent. Central- and local government had a sickness absence of 6.7 and 8.2 per cent respectively
Strong decrease in all age groups
Sickness absence fell within all age groups last year. The decrease for both women and men was the strongest among the youngest groups (below 25 years), with 20.4 and 17.4 per cent respectively.
These results are based on data on sickness absence certified by a doctor, as the survey on self-certified absence does not contain data on sickness absence by age.
Technical informationRates of change The sickness absence rates are presented using one decimal point. More decimal points are used when calculating the rates of change in order to get more accurate figures. These will therefore differ somewhat from the rates of change produced when using the published rounded figures.
The statistics do not cover self - employed persons . |
Tables:
- Table 1 Sickness absence man-days for employees self-certified and certified by a doctor. In per cent of scheduled man-days (Sickness absence rate). Quarterly figures. 2000-2010
- Table 2 Sickness absence man-days for employees self-certified and certified by a doctor, by sex. In per cent of scheduled man-days (Sickness absence rate). Quarterly figures. 2000-2010
- Table 28 Sickness absence by type of absence (self-certified or doctor-certified) and duration within the quarter
- Table 34 Cases of sickness absence and sickness absence man-days, self-certified and doctor-certified absence, by sex and duration. Per cent. Quarterly figures. 2009-2010
Tables
Contact
-
Arbeidsmarked og lønn
E-mail: arbeidsmarked@ssb.no
-
Unn H. Høydahl
E-mail: unnh.hoydahl@ssb.no
tel.: (+47) 40 90 23 77


