Content
Published:
This is an archived release.
Break in time series
A new data source from 2015 does not yet make it possible to publish the most used figure for sickness absence, i.e. the sickness absence rate. Instead, we focus on the share of employees with sickness absence as a percentage of all employees.
| 2nd quarter 2015 | |
|---|---|
| Both sexes | 5.8 |
| Males | 4.1 |
| Females | 7.6 |


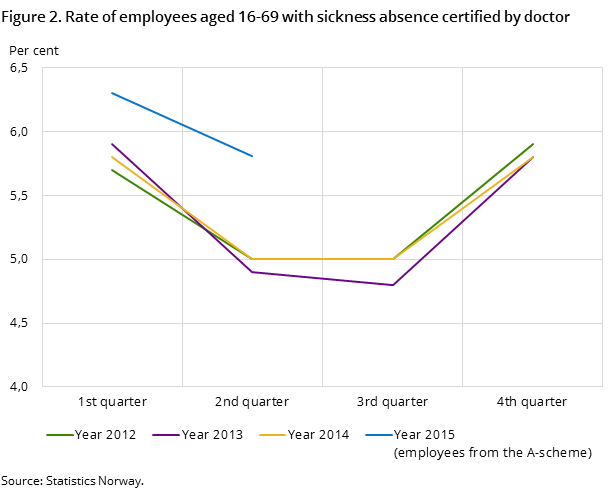
The share of employees absent from work due to doctor certified sickness was 5.8 in Q2 2015 compared to 5.0 in Q2 2014. The increase is however caused by a break in time series. A new register on employees replaced the old one in January 2015. In addition, we changed the reference week in Q2 from the last week in June to the week covering 16 June. The impact of this change in reference week is estimated to be an increase of 0.2 percentage points. Figure 2 indicates that figures based on the new register will show the same seasonal variation as the old one.
The sickness absence rate that was previously used as the main indicator was based on the number of employees converted to full-time equivalents, while the new indicator is only based on the number of employees. Up to 2015, these two indicators give the same picture of changes in sickness absence among the employees (Figure 1).
Contact
-
Arbeidsmarked og lønn
E-mail: arbeidsmarked@ssb.no
-
Unn H. Høydahl
E-mail: unnh.hoydahl@ssb.no
tel.: (+47) 40 90 23 77
