Content
Published:
This is an archived release.
Stable sickness absence
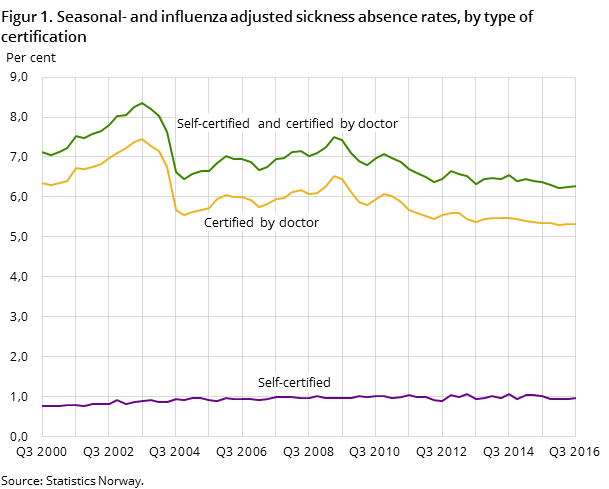
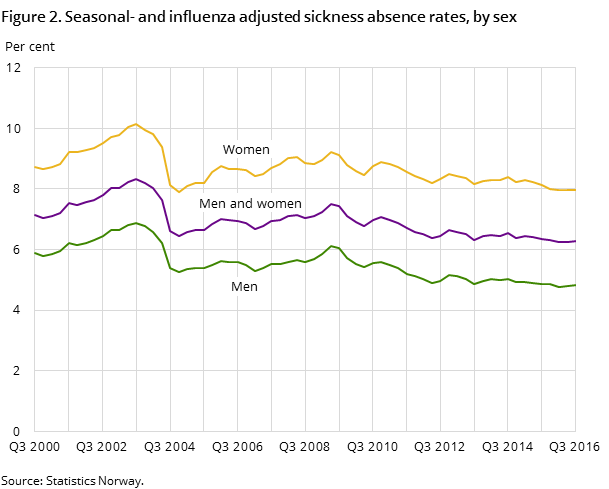
Statistics Norway has resumed the dissemination of the sickness absence rate. The sickness absence adjusted for seasonal and influenza variations was 6.3 per cent in the 3rd quarter of 2016, unchanged from the previous quarter. The sickness absence rate has remained at this level for the last three years.
| 3rd quarter 2016 | Per cent from previous quarter | |
|---|---|---|
| 1The sickness absence rates are shown to two decimal points. In other tables the rates are shown with one decimal point. More decimal points are used when calculating the rates of change in order to get more accurate figures. These will therefore differ slightly from the rates of change produced when using the published rounded figures. | ||
| Both sexes | ||
| Self-certified and certified by doctor | 6.28 | 0.4 |
| Self-certified | 0.97 | 3.1 |
| Certified by doctor | 5.31 | -0.1 |
| Males | ||
| Self-certified and certified by doctor | 4.84 | 0.7 |
| Self-certified | 0.84 | 3.0 |
| Certified by doctor | 4.01 | 0.3 |
| Females | ||
| Self-certified and certified by doctor | 7.97 | 0.2 |
| Self-certified | 1.12 | 3.2 |
| Certified by doctor | 6.84 | -0.3 |


The self-certified sickness absence rate increased by 3.1 per cent from the 2nd to the 3rd quarter of 2016, while the doctor-certified absence decreased by 0.1 per cent.
Sickness absence down 12.31 per cent since 2001
The transition to a new register from the 1st quarter of 2015 has had a small, but observable, effect on the sickness absence rate on an aggregated level. This effect is discussed further down in the article. Compared with the sickness absence in the 2nd quarter of 2001, when the IA agreement was signed, there has been a 12.31 per cent decrease in the seasonal and influenza-adjusted sickness absence. This figure is adjusted for the aforementioned effect of the transition to the new register. The goal in the IA agreement is a 20 per cent decrease.
1 The figure was corrected 22 March 2017.
The size of the effect of the new registerOpen and readClose
The transition from the Employers and employees register to “A-ordningen” resulted in a somewhat different figure for employees. This is due to both a somewhat broader coverage of the group and the fact that the quality is better. The effect of the introduction of a new register from the 1st quarter of 2015 on the sickness absence rate is very small. This includes both the self-reported and the doctor-reported sickness absence rates. However, since the self-reported absence is lower than the doctor-reported absence – the small effect has a higher impact on the change of the self-reported absence than the doctor-reported and the total absence. The table beneath show the change (measured in per cent) in seasonal and influenza adjusted figures from the 2nd quarter of 2001 to the 3rd quarter of 2016, both adjusted and not adjusted for the effect of the introduction of the new register from the 1st quarter of 2015.
Change in per cent, Q2 2001 – Q3 2016 | Self- and doctor reported | Self-reported | Doctor-reported |
| Adjusted1 | -12.3 | 26.6 | -17.0 |
| Not adjusted | -12.9 | 20.3 | -17.1 |
1 The figures were corrected 22 March 2017.
Contact
-
Arbeidsmarked og lønn
E-mail: arbeidsmarked@ssb.no
-
Unn H. Høydahl
E-mail: unnh.hoydahl@ssb.no
tel.: (+47) 40 90 23 77
