Content
Published:
This is an archived release.
Lower equity capital
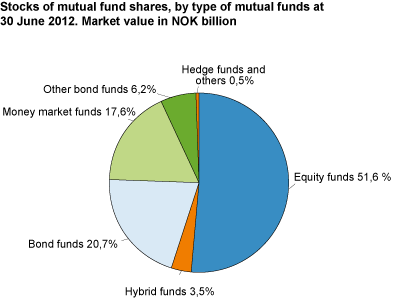
The total value of the Norwegian mutual fund shares went down to NOK 550.4 billion; NOK 11.8 lower than the previous quarter of 2012. Net purchase of fund shares was only NOK 3.0 billion during the second quarter of the year.
The total capital of mutual funds went down by 2.1 per cent, during the 2nd quarter of 2012. The main reason was the decline in the value of the equity funds by as much as NOK 17.6 billion compared to the previous quarter. The value of the money market funds was also diminished, but essentially due to net sales of these types of funds. On the other hand, the value of bond funds and other bond funds went up, due to the net purchases of such funds.
Net purchases in bond funds
A net amount of NOK 3.0 billion worth of mutual funds was purchased in the 2nd quarter of 2012. Investors net bought NOK 6.5 billion bond funds and NOK 1.5 billion worth of other bond funds.
In contrast, NOK 4.7 billion worth of money market funds were sold. Investors sold a net amount of NOK 0.2 billion worth of equity funds and net bought hybrid funds to the value of NOK 0.3 billion.
Life insurance companies continue to invest in mutual funds
The largest owners in the Norwegian mutual funds market; life insurance companies, bought a net amount of NOK 4.9 billion worth of bond funds and NOK 1.7 billion of equity funds in the second quarter of the year.
Foreigners reduced their investments in funds
Foreign investors net sold a total of NOK 1.7 billion mutual funds in the 2nd quarter of 2012. Most of the sales were in equity funds, almost 2.1 NOK billion. They have net bought bond funds and other bond funds for NOK 0.3 billion and NOK 0.2 billion respectively.
Households sold mutual funds’ shares
The household sector net sold NOK 1.2 billion of mutual funds in the 2nd quarter of 2012. NOK 0.8 billion worth of equity funds and NOK 0.7 billion worth of money market funds were sold. Net purchase of other bond funds and hybrid bonds was a mere NOK 240 million.
Increase in life insurance companies’ owner share
Life insurance companies’ owner share went up to 37.1 per cent in the second quarter of the year. Households’ owner share was lower than the previous quarter by 17.9 per cent. Foreign investors’ owner share also decreased from 14.3 to 13.4 per cent.
| Q1 2012 | Q2 2012 | ||||||||||||||||||||||||||||||||||||||||||||||||||||||||||||||||||||||||||||||
|---|---|---|---|---|---|---|---|---|---|---|---|---|---|---|---|---|---|---|---|---|---|---|---|---|---|---|---|---|---|---|---|---|---|---|---|---|---|---|---|---|---|---|---|---|---|---|---|---|---|---|---|---|---|---|---|---|---|---|---|---|---|---|---|---|---|---|---|---|---|---|---|---|---|---|---|---|---|---|---|
| Total | |||||||||||||||||||||||||||||||||||||||||||||||||||||||||||||||||||||||||||||||
| Mutual funds shares capital | 562 138 | 550 356 | |||||||||||||||||||||||||||||||||||||||||||||||||||||||||||||||||||||||||||||
| Net purchases | 12 194 | 2 976 | |||||||||||||||||||||||||||||||||||||||||||||||||||||||||||||||||||||||||||||
| General government | |||||||||||||||||||||||||||||||||||||||||||||||||||||||||||||||||||||||||||||||
| Mutual funds shares capital | 13 382 | 13 655 | |||||||||||||||||||||||||||||||||||||||||||||||||||||||||||||||||||||||||||||
| Net purchases | -219 | 353 | |||||||||||||||||||||||||||||||||||||||||||||||||||||||||||||||||||||||||||||
| Financial corporations | |||||||||||||||||||||||||||||||||||||||||||||||||||||||||||||||||||||||||||||||
| Mutual funds shares capital | 298 586 | 300 799 | |||||||||||||||||||||||||||||||||||||||||||||||||||||||||||||||||||||||||||||
| Net purchases | 10 080 | 6 699 | |||||||||||||||||||||||||||||||||||||||||||||||||||||||||||||||||||||||||||||
| Non-financial corporations | |||||||||||||||||||||||||||||||||||||||||||||||||||||||||||||||||||||||||||||||
| Mutual funds shares capital | 45 975 | 43 963 | |||||||||||||||||||||||||||||||||||||||||||||||||||||||||||||||||||||||||||||
| Net purchases | -244 | -1 750 | |||||||||||||||||||||||||||||||||||||||||||||||||||||||||||||||||||||||||||||
| Households | |||||||||||||||||||||||||||||||||||||||||||||||||||||||||||||||||||||||||||||||
| Mutual funds shares capital | 103 734 | 98 340 | |||||||||||||||||||||||||||||||||||||||||||||||||||||||||||||||||||||||||||||
| Net purchases | -1 844 | -1 179 | |||||||||||||||||||||||||||||||||||||||||||||||||||||||||||||||||||||||||||||
| Non-profit organisations | |||||||||||||||||||||||||||||||||||||||||||||||||||||||||||||||||||||||||||||||
| Mutual funds shares capital | 19 820 | 19 562 | |||||||||||||||||||||||||||||||||||||||||||||||||||||||||||||||||||||||||||||
| Net purchases | 958 | 464 | |||||||||||||||||||||||||||||||||||||||||||||||||||||||||||||||||||||||||||||
| Rest of the world | |||||||||||||||||||||||||||||||||||||||||||||||||||||||||||||||||||||||||||||||
| Mutual funds shares capital | 80 353 | 73 674 | |||||||||||||||||||||||||||||||||||||||||||||||||||||||||||||||||||||||||||||
| Net purchases | 3 493 | -1 684 | |||||||||||||||||||||||||||||||||||||||||||||||||||||||||||||||||||||||||||||
| Unspecified sector | |||||||||||||||||||||||||||||||||||||||||||||||||||||||||||||||||||||||||||||||
| Mutual funds shares capital | 288 | 363 | |||||||||||||||||||||||||||||||||||||||||||||||||||||||||||||||||||||||||||||
| Net purchases | -30 | 73 | |||||||||||||||||||||||||||||||||||||||||||||||||||||||||||||||||||||||||||||
Institutional sector classification 2012The institutional sector classification has been revised. New four-digit sector codes have been introduced and the definitions of some sectors in the classification have been changed. The revised sector classification will be implemented in the Norwegian statistical system over the next two years. The new sector classification was adopted in the mutual funds statistics at the beginning of 2012. One of the most significant changes is that the line between financial and non-financial sectors has been shifted such that the financial sectors increased in value. In addition to this, new financial sectors were added. Households and non-profit institutions will also be treated separately according to the new institutional sector classification.
Following the introduction of a new sector standard, the older series will not be updated. New tables have been introduced and these will include time series from the first quarter of 2012 onwards.
Changes in classification of fundsStatistics Norway has decided to introduce changes in the classification of the funds as of 1 January 2012. This decision is in line with the Norwegian Fund and Asset Management Association’s (VFF) standards that were introduced in 2010. According to this, a new group called ‘other bond funds’ was introduced and the money market funds were defined more precisely. |
Tables:
- Table 1 Holdings of mutual fund shares by holding sectors. NOK Million
- Table 2 Net purchases of mutual fund shares by purchasing sectors. NOK Million
- Table 3 Mutual funds' assets. Market value. NOK Million
- Table 4 Holdings of mutual fund shares, by holding sectors and type of fund on 30 June 2012. NOK million
- Table 5 Net purchases of mutual fund shares, by purchasing sectors and type of fund in the 2nd quarter of 2012. NOK million
The statistics is now published as Mutual funds.
Contact
-
Harald Stormoen
E-mail: harald.stormoen@ssb.no
tel.: (+47) 95 91 95 91
-
Steven Chun Wei Got
E-mail: steven.got@ssb.no
tel.: (+47) 90 82 68 27


