Content
Published:
This is an archived release.
Higher net purchases
The total value of the Norwegian mutual fund shares went up to NOK 581.2 billion during the 3rd quarter of the year. Net purchase of fund shares was higher than the previous quarter, at NOK 8.7 billion.
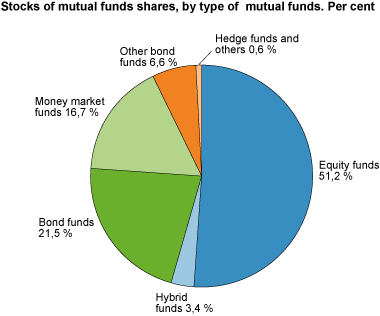
The total capital of mutual funds went up by 5.7 per cent during the 3rd quarter of 2012. The bond funds went up by 9.9 per cent, equity funds were up by 4.8 per cent and other bond funds were up by 12.8 per cent. Money market fund shares however were almost unchanged compared to the previous quarter.
The general increase in the mutual fund shares from the end of the 2nd quarter to the end of the 3rd quarter can be partly explained by an increase in the value of the equity fund shares and partly by the high net purchases of the bond funds and the other bond funds.
Net purchases in bond funds
Investors net bought NOK 8.1 billion bond funds and NOK 3.5 billion worth of other bond funds.
NOK 3 billion worth of equity funds and NOK 1 billion worth of money market funds were sold, and with investors net buying NOK 1 billion worth of other funds the net purchase of mutual funds totalled NOK 8.7 billion.
Life insurance companies’ investment continued
The largest owners in the Norwegian mutual funds market; life insurance companies, bought a net amount of NOK 6.3 billion worth of bond funds in the third quarter of the year.
Households sold mutual fund shares
The household sector continued to sell mutual fund shares and net sold mutual funds totalling NOK 1.5 billion in the 3rd quarter of 2012.
Foreign investors’ net purchases at stand still
Foreign investors net purchased a total of NOK 300 million mutual funds in the 3rd quarter of 2012. Most of the purchases were in bond funds, and totalled around NOK 347 million.
Increase in life insurance companies’ owner share
The life insurance companies’ owner share went up to 37.5 per cent in the third quarter of the year. Households’ owner share was lower than the previous quarter, at 17.5 per cent. Foreign investors’ owner share was unchanged at 13.4 per cent.
| Q1 2012 | Q2 2012 | Q3 2012 | |||||||||||||||||||||||||||||||||||||||||||||||||||||||||||||||||||||||||||||
|---|---|---|---|---|---|---|---|---|---|---|---|---|---|---|---|---|---|---|---|---|---|---|---|---|---|---|---|---|---|---|---|---|---|---|---|---|---|---|---|---|---|---|---|---|---|---|---|---|---|---|---|---|---|---|---|---|---|---|---|---|---|---|---|---|---|---|---|---|---|---|---|---|---|---|---|---|---|---|---|
| Total | |||||||||||||||||||||||||||||||||||||||||||||||||||||||||||||||||||||||||||||||
| Mutual funds shares capital | 562 137 | 550 0461 | 581 201 | ||||||||||||||||||||||||||||||||||||||||||||||||||||||||||||||||||||||||||||
| Net purchases | 12 194 | 2 9951 | 8 732 | ||||||||||||||||||||||||||||||||||||||||||||||||||||||||||||||||||||||||||||
| General government | |||||||||||||||||||||||||||||||||||||||||||||||||||||||||||||||||||||||||||||||
| Mutual funds shares capital | 13 413 | 13 676 | 13 639 | ||||||||||||||||||||||||||||||||||||||||||||||||||||||||||||||||||||||||||||
| Net purchases | -218 | 362 | -432 | ||||||||||||||||||||||||||||||||||||||||||||||||||||||||||||||||||||||||||||
| Financial corporations | |||||||||||||||||||||||||||||||||||||||||||||||||||||||||||||||||||||||||||||||
| Mutual funds shares capital | 298 587 | 300 788 | 319 945 | ||||||||||||||||||||||||||||||||||||||||||||||||||||||||||||||||||||||||||||
| Net purchases | 10 080 | 6 699 | 7 677 | ||||||||||||||||||||||||||||||||||||||||||||||||||||||||||||||||||||||||||||
| Non-financial corporations | |||||||||||||||||||||||||||||||||||||||||||||||||||||||||||||||||||||||||||||||
| Mutual funds shares capital | 45 900 | 43 919 | 47 270 | ||||||||||||||||||||||||||||||||||||||||||||||||||||||||||||||||||||||||||||
| Net purchases | -212 | -1 747 | 1 920 | ||||||||||||||||||||||||||||||||||||||||||||||||||||||||||||||||||||||||||||
| Households | |||||||||||||||||||||||||||||||||||||||||||||||||||||||||||||||||||||||||||||||
| Mutual funds shares capital | 103 733 | 98 123 | 101 492 | ||||||||||||||||||||||||||||||||||||||||||||||||||||||||||||||||||||||||||||
| Net purchases | -1 844 | -1 172 | -1 445 | ||||||||||||||||||||||||||||||||||||||||||||||||||||||||||||||||||||||||||||
| Non-profit organisations | |||||||||||||||||||||||||||||||||||||||||||||||||||||||||||||||||||||||||||||||
| Mutual funds shares capital | 19 871 | 19 515 | 20 914 | ||||||||||||||||||||||||||||||||||||||||||||||||||||||||||||||||||||||||||||
| Net purchases | 926 | 464 | 717 | ||||||||||||||||||||||||||||||||||||||||||||||||||||||||||||||||||||||||||||
| Rest of the world | |||||||||||||||||||||||||||||||||||||||||||||||||||||||||||||||||||||||||||||||
| Mutual funds shares capital | 80 415 | 73 751 | 77 729 | ||||||||||||||||||||||||||||||||||||||||||||||||||||||||||||||||||||||||||||
| Net purchases | 3 503 | -1 608 | 301 | ||||||||||||||||||||||||||||||||||||||||||||||||||||||||||||||||||||||||||||
| Unspecified sector | |||||||||||||||||||||||||||||||||||||||||||||||||||||||||||||||||||||||||||||||
| Mutual funds shares capital | 218 | 274 | 212 | ||||||||||||||||||||||||||||||||||||||||||||||||||||||||||||||||||||||||||||
| Net purchases | -41 | -3 | -6 | ||||||||||||||||||||||||||||||||||||||||||||||||||||||||||||||||||||||||||||
Institutional sector classification 2012The institutional sector classification has been revised. New four-digit sector codes have been introduced and the definitions of some sectors in the classification have been changed. The revised sector classification will be implemented in the Norwegian statistical system over the next two years. The new sector classification was adopted in the mutual funds statistics at the beginning of 2012. One of the most significant changes is that the line between financial and non-financial sectors has been shifted such that the financial sectors increased in value. In addition to this, new financial sectors were added. Households and non-profit institutions will also be treated separately according to the new institutional sector classification.
Following the introduction of a new sector standard, the older series will not be updated. New tables have been introduced and these will include time series from the first quarter of 2012 onwards.
Changes in classification of fundsStatistics Norway has decided to introduce changes in the classification of the funds as of 1 January 2012. This decision is in line with the Norwegian Fund and Asset Management Association’s (VFF) standards, which were introduced in 2010. According to this, a new group called ‘other bond funds’ was introduced and the money market funds were defined more precisely. |
Tables:
- Table 1 Holdings of mutual fund shares, by holding sectors and type of fund. NOK million
- Table 2 Net purchases of mutual fund shares by purchasing sectors and type of fund. NOK million
- Table 3 Mutual funds' assets. Market value. NOK million
- Table 4 Holdings of mutual fund shares, by holding sectors and type of fund on 30th September 2012. NOK million
- Table 5 Net purchases of mutual fund shares, by purchasing sectors and type of fund on 30.9.2012.NOK million
The statistics is now published as Mutual funds.
Contact
-
Harald Stormoen
E-mail: harald.stormoen@ssb.no
tel.: (+47) 95 91 95 91
-
Steven Chun Wei Got
E-mail: steven.got@ssb.no
tel.: (+47) 90 82 68 27


