Content
Published:
This is an archived release.
Share dividends at a historically high level
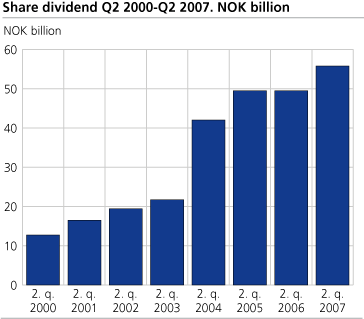
The owners of companies registered with the Norwegian Central Securities Depositary received large amounts of share dividends in the second quarter of 2007. In the same period, the values of the stock of shares increased by 10 per cent, caused by a further increase in share prices at Oslo Stock Exchange (OSE).
Based on the payments of NOK 55.8 billion of share dividend registered in the second quarter, 2007 as a whole will probably reach the highest level of dividend payments ever registered.
Other private non-financial companies and state enterprises paid out NOK 23.7 billion and NOK 19.9 billion respectively. Nearly 37 per cent of the share dividends were received by central government, and nearly 29 per cent went to foreign share owners.
The high activity in the primary market by the end of last year and the first quarter of 2007 continued in the second quarter. Measured by market value, the companies registered with the Norwegian Central Securities Depositary issued new shares for NOK 44.0 billion in the second quarter of 2007.
Stock market in further progress
Measured in market value, the stocks of shares registered with the Norwegian Central Securities Depositary, increased by 10.3 per cent in the second quarter of 2007, and amounted to NOK 2576.4 billion. The main reason for this growth was higher share prices on the Oslo Stock Exchange (OSE). The OSE All-share Index rose by 12.6 per cent in the second quarter. Foreigners increased their ownership by 0.5 per cent in the period, and now own 38.3 per cent of the stocks of shares registered in the Norwegian Central Securities Depositary. The stocks of shares are, by the end of the second quarter, divided into NOK 2195.9 billion in quoted shares and NOK 380.5 billion in unquoted shares.
The stocks of bonds registered with the Norwegian Central Securities Depositary increased by 2.6 per cent in the second quarter of 2007 and amounted to NOK 742.0 billion, while the stock of short-term securities was slightly reduced by 0.7 per cent, to NOK 97.4 billion.
| Securities registered with VPS. Market value in NOK billion |
| Q2 2006 | Q3 2006 | Q4 2006 | Q1 2007 | Q2 2007 | |||||||||||||||||||||||||||||||||||
|---|---|---|---|---|---|---|---|---|---|---|---|---|---|---|---|---|---|---|---|---|---|---|---|---|---|---|---|---|---|---|---|---|---|---|---|---|---|---|---|
| Stocks | |||||||||||||||||||||||||||||||||||||||
| Shares | 1 770.4 | 1 761.2 | 2 201.8 | 2 336.0 | 2 576.4 | ||||||||||||||||||||||||||||||||||
| Bonds | 662.8 | 685.5 | 754.7 | 723.5 | 742.0 | ||||||||||||||||||||||||||||||||||
| Short-term securities | 116.2 | 115.8 | 99.7 | 98.1 | 97.4 | ||||||||||||||||||||||||||||||||||
| Net purchases/sales | |||||||||||||||||||||||||||||||||||||||
| Shares | 25.3 | 9.3 | 38.0 | 32.9 | 30.8 | ||||||||||||||||||||||||||||||||||
| Bonds | 23.8 | 23.6 | 55.9 | -22.5 | 24.1 | ||||||||||||||||||||||||||||||||||
| Short-term securities | -5.8 | -0.2 | -14.5 | -1.3 | -0.7 | ||||||||||||||||||||||||||||||||||
| Dividends/cupon payments | |||||||||||||||||||||||||||||||||||||||
| Shares | 49.5 | 3.8 | 2.0 | 4.3 | 55.8 | ||||||||||||||||||||||||||||||||||
| Bonds | 12.1 | 3.8 | 6.8 | 7.5 | 15.7 | ||||||||||||||||||||||||||||||||||
| Short-term securities | 0.5 | 0.4 | 0.6 | 0.4 | 0.5 | ||||||||||||||||||||||||||||||||||
The statistics is now published as Securities.
Contact
-
Statistics Norway's Information Centre
E-mail: informasjon@ssb.no
tel.: (+47) 21 09 46 42


