Content
Published:
This is an archived release.
The financial crisis hit the equity market
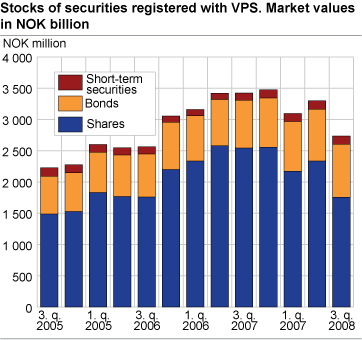
The global financial crisis hit the Norwegian equity market with full strength in the third quarter of 2008. At the end of the quarter the total value of shares registered with The Norwegian Central Securities Depository was the same as two years ago.
The international financial crisis deepened considerably during the third quarter of 2008 resulting in a sharp fall in foreign equity markets and in the oil price. The Norwegian equity market developed in the same direction as the international markets and share values amounting to NOK 582.7 billion disappeared from the companies registered with The Norwegian Central Securities Depository during the quarter. Measured in market value the total share values amounted to NOK 1755.2 billion at the end of the quarter, back to the same level as the end of the third quarter of 2006. Of the total share values in the third quarter, quoted shares amounted to NOK 1346.3 billion and unquoted shares to NOK 408.9 billion.
Foreigners selling shares
Foreign share owners continued their sales of shares in companies registered with The Norwegian Central Securities Depository in the third quarter, and have net sold shares for nearly NOK 15 billion so far in 2008. In comparison foreign share owners net purchased shares for nearly NOK 60 billion during 2007. Foreigners have reduced their total ownership of shares by 1.8 per cent to 35.8 per cent at the end of the quarter. In the same period private non-financial companies have increased their ownership by 3 per cent to 23 per cent through net purchasing of shares for more than NOK 21 billion. Also Central government net purchased shares for nearly NOK 7 billion in the third quarter, mainly shares in state enterprises. Still Central government reduced their ownership in companies registered with The Norwegian Central Securities Depository by 1.6 per cent to 26.2 per cent during the quarter.
Slowdown in the primary market
Due to the financial crisis the primary market for shares almost faded out during the third quarter of 2008. It was issued shares for nearly NOK 23 billion in the quarter, mainly in July. In August and September the total issuing of shares amounted to just NOK 5 billion.
Stocks of debt securities registered with the Norwegian Central Securities Depository increased in the third quarter of 2008. The stock of bonds increased by 2.7 per cent, to NOK 848.8 billion, and the stock of short-term debt securities increased by 2.5 per cent, to NOK 130.6 billion.
| Q3 2007 | Q4 2007 | Q1 2008 | Q2 2008 | Q3 2008 | |||||||||||||||||||||||||||||||||||
|---|---|---|---|---|---|---|---|---|---|---|---|---|---|---|---|---|---|---|---|---|---|---|---|---|---|---|---|---|---|---|---|---|---|---|---|---|---|---|---|
| Stocks | |||||||||||||||||||||||||||||||||||||||
| Shares | 2 541.9 | 2 556.6 | 2 174.4 | 2 337.9 | 1 755.2 | ||||||||||||||||||||||||||||||||||
| Bonds | 766.6 | 788.1 | 794.8 | 826.4 | 848.8 | ||||||||||||||||||||||||||||||||||
| Short-term securities | 114.9 | 130.3 | 128.3 | 134.0 | 130.6 | ||||||||||||||||||||||||||||||||||
| Net purchases/sales | |||||||||||||||||||||||||||||||||||||||
| Shares | 5.7 | 36.9 | -0.9 | 19.7 | 16.0 | ||||||||||||||||||||||||||||||||||
| Bonds | 24.5 | 23.7 | 9.7 | 40.5 | 11.1 | ||||||||||||||||||||||||||||||||||
| Short-term securities | 16.7 | 14.9 | -2.8 | 4.4 | -2.2 | ||||||||||||||||||||||||||||||||||
| Dividends/cupon payments | |||||||||||||||||||||||||||||||||||||||
| Shares | 3.7 | 3.7 | 2.9 | 68.7 | 3.9 | ||||||||||||||||||||||||||||||||||
| Bonds | 5.8 | 7.8 | 7.9 | 19.2 | 8.2 | ||||||||||||||||||||||||||||||||||
| Short-term securities | 0.6 | 0.6 | 0.9 | 1.0 | 1.0 | ||||||||||||||||||||||||||||||||||
The statistics is now published as Securities.
Contact
-
Statistics Norway's Information Centre
E-mail: informasjon@ssb.no
tel.: (+47) 21 09 46 42

