Content
Published:
This is an archived release.
Sharp fall in share dividends
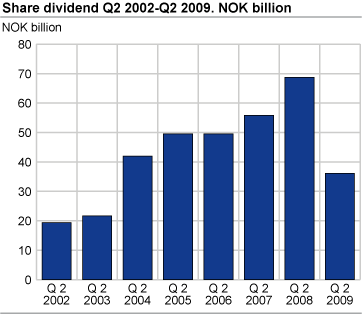
The payments of share dividends in companies registered at the Norwegian Central Securities Depository were reduced by nearly 50 per cent in the second quarter of 2009 compared with the same quarter of 2008. Share dividends are at its lowest level since the second quarter of 2003.
Due to the global financial crisis and setback in the world economy from the second half of 2008, the payments of share dividends in companies registered with The Norwegian Central Securities Depository are at their lowest level in six years. In the second quarter of 2009 the share owners received NOK 36 billion in share dividends compared with nearly NOK 69 billion in the second quarter of 2008.
Highest payments from state owned enterprises
In the second quarter of 2009 state owned enterprises paid out NOK 23.3 billion. Compared to last year the payments fell by almost NOK 10 billion. The central government received the highest share of dividends from the state owned enterprises, with payments of NOK 16.5 billion, because of their high owner share in these enterprises. Foreign investors received a whole NOK 5.9 billion out of the remaining dividends to be paid out by state owned enterprises.
The fall in paid out dividends was especially high from the financial enterprises and the private owned enterprises. These sectors paid out NOK 925 million and NOK 11 billion in the second quarter of 2009 compared to NOK 9.1 and NOK 22.8 billion in the second quarter of 2008
Share market in progress
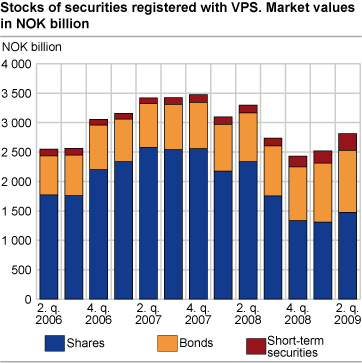
After three quarters with decreases in share values, where the value of companies registered with the Norwegian Central Securities Depository fell by more than NOK 1000 billion, the share values increased by NOK 165 billon in the second quarter of 2009. Total value of shares amounted to NOK 1 473 billion at the end of this quarter. The share values were, by the end of the quarter, divided into NOK 1121 billion of quoted shares and NOK 352 billion of unquoted shares.
Reduced ownership among foreign investors
Foreign owners continued to reduce their ownership of shares, and in the second quarter of 2009 their net sales totalled NOK 11 billion. Foreigners have net sold shares registered with The Norwegian Central Securities Depository in the last six quarters and have reduced their ownership from 38 per cent at the beginning of 2008 to 31 per cent at the end of the second quarter of 2009. The central government has in contrast increased their owner share during the same period to 29.6 per cent.
Government measures increase stocks of debt securities
Stocks of debt securities registered with the Norwegian Central Securities Depository increased in the second quarter of 2009. The stock of bonds increased by 5 per cent, to NOK 1053.8 billion, and the stock of short-term debt securities increased by 38 per cent, to NOK 286.3 billion. The growth in the stocks of debt securities is mainly caused by an increase in issuing activity due to government measures established in October 2008 to improve the liquidity in Norwegian banks1.
1The government measures, established in October 2008, to improve the liquidity in Norwegian banks mean that the banks can exchange their covered bonds with government securities. In the VPS statistics, these covered bonds are registered as owned by the government in the exchange period. In the bank accounts, these covered bonds are kept as assets and as government loans on the liability side.
| Q2 2008 | Q3 2008 | Q4 2008 | Q1 2009 | Q2 2009 | |||||||||||||||||||||||||||||||||||
|---|---|---|---|---|---|---|---|---|---|---|---|---|---|---|---|---|---|---|---|---|---|---|---|---|---|---|---|---|---|---|---|---|---|---|---|---|---|---|---|
| Stocks | |||||||||||||||||||||||||||||||||||||||
| Shares | 2 337.9 | 1 755.2 | 1 333.4 | 1 308.0 | 1 473.5 | ||||||||||||||||||||||||||||||||||
| Bonds | 826.4 | 848.8 | 916.4 | 1 003.6 | 1 053.8 | ||||||||||||||||||||||||||||||||||
| Short-term securities | 134.0 | 130.6 | 181.9 | 207.4 | 286.3 | ||||||||||||||||||||||||||||||||||
| Net purchases/sales | |||||||||||||||||||||||||||||||||||||||
| Shares | 19.7 | 16.0 | 3.0 | 11.5 | -1.6 | ||||||||||||||||||||||||||||||||||
| Bonds | 40.5 | 11.1 | 74.6 | 92.1 | 66.7 | ||||||||||||||||||||||||||||||||||
| Short-term securities | 4.4 | -2.2 | 49.8 | 24.5 | 84.2 | ||||||||||||||||||||||||||||||||||
| dividends/cupon payments | |||||||||||||||||||||||||||||||||||||||
| Shares | 68.7 | 3.9 | 0.9 | 0.7 | 36.1 | ||||||||||||||||||||||||||||||||||
| Bonds | 19.2 | 8.2 | 9.3 | 9.3 | 21.4 | ||||||||||||||||||||||||||||||||||
| Short-term securities | 1.0 | 1.0 | 1.5 | 1.6 | 1.2 | ||||||||||||||||||||||||||||||||||
The statistics is now published as Securities.
Contact
-
Statistics Norway's Information Centre
E-mail: informasjon@ssb.no
tel.: (+47) 21 09 46 42


