Content
Published:
This is an archived release.
Households invest in shares
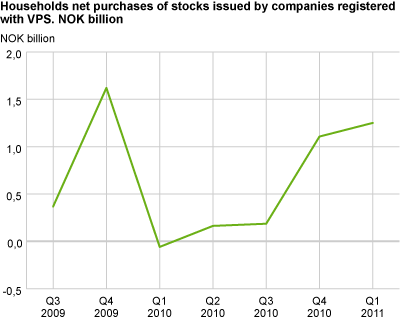
In the first quarter of 2011, households net purchased shares registered with the Norwegian Central Securities Depository (VPS) for NOK 1.2 billion. This is the highest amount that households have invested in shares in a quarter since the fourth quarter of 2009.
Slightly more than half of the households’ net purchases were made in the secondary market. The remainder of the net purchases were made in relation to share issues. This the second quarter in a row where households were net purchasers of shares. In the previous quarter, households’ net purchases amounted to NOK 1.1 billion.
The fourth quarter of 2010 was the second quarter in a row where foreign investors were net purchasers of stocks. In the previous quarter, foreigners’ net purchases amounted to NOK 14 billion, while the net purchases nearly doubled in the fourth quarter of 2010. For the whole of 2010, foreign investors’ net purchases of shares amounted to NOK 18 billion.
Foreigners continue to invest in shares
Foreign investors’ net purchases of shares amounted to NOK 27 billion in the first quarter of 2011. Two thirds of these were purchases in share issues of Hydro shares. These purchases were made in relation to Hydro’s takeover of parts of the foreign-based enterprise Vale. The share issue of Hydro means that Vale now holds 22 per cent of the outstanding shares.
Central government net sells shares
Central government was the owner sector that stood for the highest net sales of shares in the quarter. Net sales amounted to NOK 3.6 billion and were primarily made in foreign and private incorporated enterprises.
Increased holdings of long-term bonds
The private incorporated enterprises net purchased shares for NOK 4.2 billion in the quarter. The purchases were primarily made in other enterprises
Increased stocks of debt securities
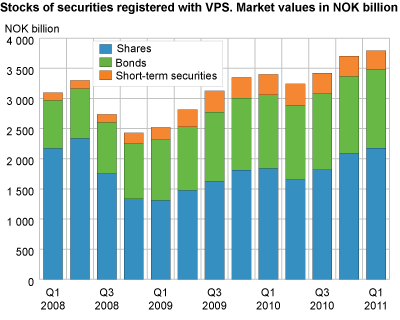
Stocks of debt securities registered with the Norwegian Central Securities Depository increased in the first quarter of 2011.The stock of bonds increased by NOK 15 billion to NOK 1 303 billion. The main cause of this increase is that a new statistical system was used in producing the statistics, resulting in a rise in the market values of bonds. Stocks of short-term debt securities fell by about 9 per cent, to NOK 312 billion, during the period.
New statistical system affects statisticsFrom the first quarter of 2011, a new statistical system was used in the production of the statistic. This has affected the numbers. In particular, the market value of bonds has risen by about NOK 12 billion. Apart from these adjustments, the changes in values are not very significant. The new statistical system will provide higher quality and relevance of the statistics. |
| Q1 2010 | Q2 2010 | Q3 2010 | Q4 2010 | Q1 2011 | |||||||||||||||||||||||||||||||||||||||||||||||||||||||||||||||||||||||||||
|---|---|---|---|---|---|---|---|---|---|---|---|---|---|---|---|---|---|---|---|---|---|---|---|---|---|---|---|---|---|---|---|---|---|---|---|---|---|---|---|---|---|---|---|---|---|---|---|---|---|---|---|---|---|---|---|---|---|---|---|---|---|---|---|---|---|---|---|---|---|---|---|---|---|---|---|---|---|---|---|
| Stocks | |||||||||||||||||||||||||||||||||||||||||||||||||||||||||||||||||||||||||||||||
| Shares | 1 839.3 | 1 653.7 | 1 815.4 | 2 087.8 | 2 178.1 | ||||||||||||||||||||||||||||||||||||||||||||||||||||||||||||||||||||||||||
| Bonds | 1 218.9 | 1 237.0 | 1 259.4 | 1 278.0 | 1 303.3 | ||||||||||||||||||||||||||||||||||||||||||||||||||||||||||||||||||||||||||
| Short-term securities | 342.3 | 349.9 | 345.8 | 337.8 | 311.9 | ||||||||||||||||||||||||||||||||||||||||||||||||||||||||||||||||||||||||||
| Net purchases/sales | |||||||||||||||||||||||||||||||||||||||||||||||||||||||||||||||||||||||||||||||
| Shares | 3.3 | 8.3 | 17.2 | 23.7 | 26.4 | ||||||||||||||||||||||||||||||||||||||||||||||||||||||||||||||||||||||||||
| Bonds | 15.0 | 11.4 | 18.2 | 22.7 | 15.7 | ||||||||||||||||||||||||||||||||||||||||||||||||||||||||||||||||||||||||||
| Short-term securities | -2.5 | 8.0 | -4.3 | -7.1 | -26.8 | ||||||||||||||||||||||||||||||||||||||||||||||||||||||||||||||||||||||||||
| dividends/cupon payments | |||||||||||||||||||||||||||||||||||||||||||||||||||||||||||||||||||||||||||||||
| Shares | 2.0 | 41.7 | 5.8 | 3.2 | 2.6 | ||||||||||||||||||||||||||||||||||||||||||||||||||||||||||||||||||||||||||
| Bonds | 8.5 | 22.3 | 8.7 | 9.8 | 10.1 | ||||||||||||||||||||||||||||||||||||||||||||||||||||||||||||||||||||||||||
| Short-term securities | 0.6 | 0.3 | 0.4 | 0.3 | 0.4 | ||||||||||||||||||||||||||||||||||||||||||||||||||||||||||||||||||||||||||
The statistics is now published as Securities.
Contact
-
Statistics Norway's Information Centre
E-mail: informasjon@ssb.no
tel.: (+47) 21 09 46 42


