Content
Published:
This is an archived release.
Further increase in equity values
The value of shares registered with the Central Securities Depository (VPS) increased by nearly 7 per cent in the first quarter of 2012. Foreign investors made the highest net purchases of shares in the first quarter.
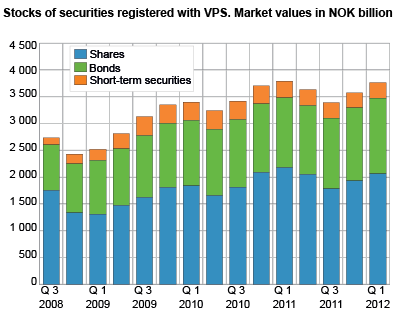
A significant increase in the value of VPS registered shares for two successive quarters has contributed to reducing the loss of value in the second and third quarters of 2011. The stocks of shares were at the lowest level in the third quarter of 2011, when the shares were valued at NOK 1 793 billion. At the end of the first quarter of 2012, the stocks of the VPS registered shares stood at NOK 2 061 billion, which is NOK 133 billion higher than in the previous quarter and NOK 266 billion more than in the third quarter of 2011. All increases in value were in the listed shares.
Institutional sector classification 2012The institutional sector classification has been revised. New four-digit sector codes have been introduced and the definitions of some sectors in the classification have been changed. The revised sector classification will be implemented in the Norwegian statistical system over the next two years.
The new institutional sector classification was introduced in statistics for securities registered at VPS from January 2012. One of the most significant changes was that the line between financial and non-financial sectors has been shifted such that the financial sectors increased in value. In addition to this, new financial sectors were added.
The introduction of a new sector standard has caused the old tables to stop being updated. New tables have been added that include time series from the first quarter of 2012 and onwards. |
Holdings of the VPS registered shares at the end of the first quarter of 2012 totalled NOK 1 639 billion in listed shares and NOK 423 billion in unlisted shares. The listed shares, which include shares listed on the Oslo Stock Exchange’s main list as well as on the Oslo Axess list, increased in value by nearly 10 per cent in the first quarter. The unlisted shares, which are very seldom traded and therefore vary little in price, fell by 3 per cent in the first quarter.
Foreigners with highest net purchases in shares
Foreign investors invested the highest amount in listed shares; NOK 3.7 billion. Nearly NOK 3 billion of these investments were made in shares issued by domestically registered enterprises. At the end of the quarter, foreign investors and general government had an almost equal share, of 36 per cent, of the listed shares. This includes shares issued by both domestic and foreign-based enterprises. General government net sold shares in excess of NOK 1 billion in the first quarter.
Increased stocks of long-term debt securities
In the first quarter, the stock of bonds was increased by NOK 46 billion to NOK 1 412 billion. Holdings of short-term bonds also increased in the first quarter by in excess of NOK 10 billion to NOK 291 billion. See the statistic “ Bonds and commercial papers ” for more information on which sectors issued the bonds.
| Q1 2011 | Q2 2011 | Q3 2011 | Q4 2011 | Q1 2012 | |||||||||||||||||||||||||||||||||||||||||||||||||||||||||||||||||||||||||||
|---|---|---|---|---|---|---|---|---|---|---|---|---|---|---|---|---|---|---|---|---|---|---|---|---|---|---|---|---|---|---|---|---|---|---|---|---|---|---|---|---|---|---|---|---|---|---|---|---|---|---|---|---|---|---|---|---|---|---|---|---|---|---|---|---|---|---|---|---|---|---|---|---|---|---|---|---|---|---|---|
| Stocks | |||||||||||||||||||||||||||||||||||||||||||||||||||||||||||||||||||||||||||||||
| Shares 1 | 2 178.1 | 2 053.3 | 1 782.8 | 1 928.3 | 2 061.4 | ||||||||||||||||||||||||||||||||||||||||||||||||||||||||||||||||||||||||||
| Bonds | 1 303.3 | 1 283.8 | 1 317.9 | 1 363.5 | 1 412.9 | ||||||||||||||||||||||||||||||||||||||||||||||||||||||||||||||||||||||||||
| Short-term securities | 311.9 | 301.6 | 289.7 | 280.3 | 291.0 | ||||||||||||||||||||||||||||||||||||||||||||||||||||||||||||||||||||||||||
| Net purchases/sales | |||||||||||||||||||||||||||||||||||||||||||||||||||||||||||||||||||||||||||||||
| Shares 1 | 26.4 | 23.0 | 4.3 | 10.6 | 2.9 | ||||||||||||||||||||||||||||||||||||||||||||||||||||||||||||||||||||||||||
| Bonds | 15.7 | -17.0 | 22.5 | 46.0 | 46.0 | ||||||||||||||||||||||||||||||||||||||||||||||||||||||||||||||||||||||||||
| Short-term securities | -26.8 | -10.1 | -12.4 | -9.5 | 10.7 | ||||||||||||||||||||||||||||||||||||||||||||||||||||||||||||||||||||||||||
| Dividends/cupon payments | |||||||||||||||||||||||||||||||||||||||||||||||||||||||||||||||||||||||||||||||
| Shares 1 | 2.6 | 59.3 | 5.5 | 7.7 | 2.8 | ||||||||||||||||||||||||||||||||||||||||||||||||||||||||||||||||||||||||||
| Bonds | 10.1 | 25.1 | 9.8 | 11.6 | 11.6 | ||||||||||||||||||||||||||||||||||||||||||||||||||||||||||||||||||||||||||
| Short-term securities | 0.4 | 0.5 | 0.5 | 0.5 | 0.6 | ||||||||||||||||||||||||||||||||||||||||||||||||||||||||||||||||||||||||||
| 1 | Shares include both listed and unlisted shares. |
New divide between listed and unlisted sharesFrom the first quarter of 2012, listed and unlisted shares will be differentiated from another. Here, listed shares are shares listed for trading at the Oslo Stock Exchange and Oslo Axxess.
Detailed information available in StatBank
More detailed information on transactions, dividends and holdings of shares, equity certificates and bonds are available in StatBank. Click “StatBank” at the left of the screen to access StatBank. |
Tabeller
The statistics is now published as Securities.
Contact
-
Statistics Norway's Information Centre
E-mail: informasjon@ssb.no
tel.: (+47) 21 09 46 42

