Content
Published:
This is an archived release.
Continued growth in urban settlements
Almost 80 per cent of the population of Norway lives in urban settlements as of 1 January 2011. The number of inhabitants in urban settlements increased by 120 000, or 3.2 per cent from 2009 to 2011. In the same period, the land area covered by urban settlements increased by 64 km2, or 2.7 per cent. In the period 2002 to 2011, the population in urban settlements increased by 425 000 (12 per cent), while the land area increased by 210 square kilometres (10 per cent).
All in all, 3 900 000 inhabitants lived in a total of 936 urban settlements in Norway as of 1 January 2011. From 2009 to 2011 the counties of Akershus, Oslo and Rogaland had the highest growth in the urban population with nearly 4 per cent. The population in urban settlements in these three counties increased by 55 000, or 45 per cent of the total growth in urban settlements. The lowest rate of increase in the population in urban settlements in this period has been recorded in the counties Hedmark and Telemark with about 2 per cent. The corresponding growth rate for the whole country was 2.5 per cent.
High population growth in the six largest urban settlements
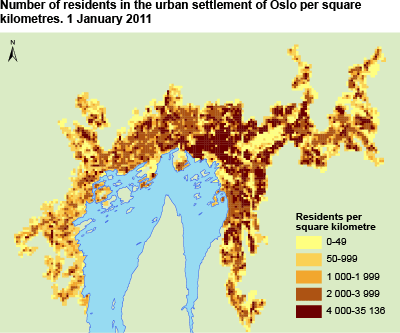
The urban settlements Oslo, Bergen, Stavanger/Sandnes, Trondheim, Fredrikstad/Sarpsborg and Drammen all have more than 100 000 inhabitants. The population of these six urban settlements increased by 57 000 from 2009 to 2011, or 48 per cent of the total increase in urban settlements. These urban settlements constitute 44 per cent of the total population in urban settlements as of 1 January 2011.
In the period 2002 to 2011, the population in these six urban settlements increased by 23 per cent, while the land area increased by 20 per cent., which shows an increasing efficiency in land use. The population density increased from an average 2 386 inhabitants per square kilometre to 2 640 inhabitants per square kilometre. The corresponding population density in the rest of the urban settlements is 1 250 inhabitants per square kilometre.
| 2011 | Change from 2009 to 2011 | ||||||||||||||||||||||||||||||||||||||||||||||||||||||||||||||||||||||||||||||
|---|---|---|---|---|---|---|---|---|---|---|---|---|---|---|---|---|---|---|---|---|---|---|---|---|---|---|---|---|---|---|---|---|---|---|---|---|---|---|---|---|---|---|---|---|---|---|---|---|---|---|---|---|---|---|---|---|---|---|---|---|---|---|---|---|---|---|---|---|---|---|---|---|---|---|---|---|---|---|---|
| Residents | Area. km2 | Residents per km2 | Number of urban settlements | Residents | Area. km2 | Residents per km2 | Number of urban settlements | ||||||||||||||||||||||||||||||||||||||||||||||||||||||||||||||||||||||||
| Total | 3 899 115 | 2 403.34 | 1 622 | 936 | 119 047 | 63.51 | 7 | 17 | |||||||||||||||||||||||||||||||||||||||||||||||||||||||||||||||||||||||
| 200-499 residents | 112 691 | 165.49 | 681 | 333 | -1 614 | -0.13 | -9 | -1 | |||||||||||||||||||||||||||||||||||||||||||||||||||||||||||||||||||||||
| 500-999 residents | 164 223 | 202.66 | 810 | 236 | 10 570 | 12.98 | 0 | 15 | |||||||||||||||||||||||||||||||||||||||||||||||||||||||||||||||||||||||
| 1 000-1 999 residents | 204 221 | 207.48 | 984 | 144 | -4 838 | -2.91 | -10 | -4 | |||||||||||||||||||||||||||||||||||||||||||||||||||||||||||||||||||||||
| 2 000-19 999 residents | 1 099 617 | 825.46 | 1 332 | 203 | 43 703 | 34.02 | -2 | 7 | |||||||||||||||||||||||||||||||||||||||||||||||||||||||||||||||||||||||
| 20 000-99 999 residents | 609 146 | 355.00 | 1 716 | 14 | -82 250 | -41.35 | -28 | -1 | |||||||||||||||||||||||||||||||||||||||||||||||||||||||||||||||||||||||
| 100 000 or more residents1 | 1 709 217 | 647.25 | 2 641 | 6 | 153 476 | 60.90 | -12 | 1 | |||||||||||||||||||||||||||||||||||||||||||||||||||||||||||||||||||||||
| 1 | Drammen is now included in the sizegroup 100 000 or more residents. |
The smallest urban settlements in majority
As many as 569 urban settlements had less than 1 000 residents as of 1 January 2011. These constitute only 7 per cent of the total population in urban settlements, but as much as 15 per cent of total land area covered by urban settlements.
The number of urban settlements has increased by 17 from 2009 to 2011. Twenty-two new urban settlements have been established and 5 urban settlements have been omitted.
Increase in land area covered by urban settlements
In total, 2 403 square kilometres of the land area of Norway was made up of urban settlements as of 1 January 2011. The urban settlements area increased by 64 square kilometres, or 2.7 per cent. Since 2002 the urban settlements area has increased by 210 square kilometres.
The population density for urban settlements in Norway is averaged to 1 622 as per 1 January 2011, compared to 1 615 on 1 January 2009. In 2002 the population density was 1 584 square kilometres.
Urban settlementA hub of buildings is to be registered as an urban settlement if it is inhabited by at least 200 persons. The distance between the buildings must not exceed 50 metres. Exceptions are allowed for areas that cannot/are not to be occupied, for example parks, sports facilities, industrial areas or natural barriers such as rivers or arable land. Agglomerations that naturally belong to the urban settlement with up to a distance of 400 metres from the centre of the urban settlement are also included. |
Tables:
Contact
-
Even Høydahl
E-mail: even.hoydahl@ssb.no
tel.: (+47) 95 77 79 06
-
Dana Moe
E-mail: dana.moe@ssb.no
tel.: (+47) 99 85 23 42
-
Vilni Verner Holst Bloch
E-mail: vilni.verner.holst.bloch@ssb.no
tel.: (+47) 94 82 25 32
-
Statistics Norway's Information Centre
E-mail: informasjon@ssb.no
tel.: (+47) 21 09 46 42

