Content
Published:
This is an archived release.
The gender gap decreases
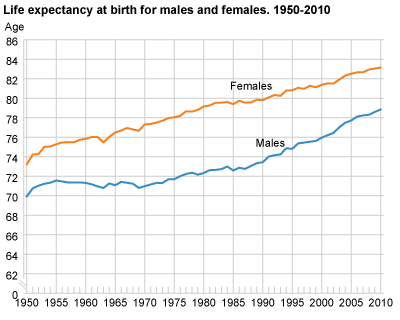
Women still live longer than men, but the difference between the sexes is decreasing. From 2009 to 2010, life expectancy at birth increased by 0.1 years for women and 0.3 years for men, to 83.2 years for women and 78.9 for men.
During the last 25 years, the life expectancy in Norway has increased by nearly 6 years for men and almost 3 years for women. In the same period, the difference in life expectancy between men and women decreased by about 2.5 years. In 2010, Norwegian women could expect to live 4.3 years longer than Norwegian men. Lower infant mortality and a decrease in death rates among children are important reasons for the increase in life expectancy. A decrease in death among the oldest has also influenced the life expectancy.
In the period 2006-2010, the county Sogn og Fjordane had the highest life expectancy at 79.7 years for men and 84.2 years for women. The county Finnmark had the lowest life expectancy with 76.3 years for men and 81.6 years for women.
|
Life expectancy is the number of years a person at a specific age may expect to live under the prevailing conditions of death, usually in one calendar year. |
Japanese women and Swiss men lives longest
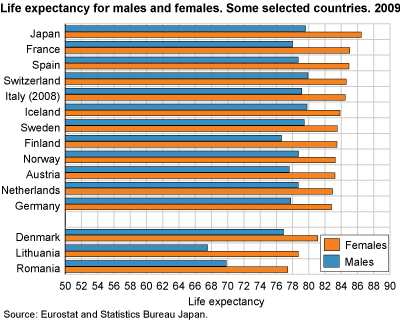
For several years, Japan has had the highest life expectancy for women in the world. In 2009 a Japanese newborn girl could expect to be 86.4 years old. In 2009, the highest life expectancy for men was in Switzerland. A newborn boy in Switzerland could expect to live to 79.9 years of age, while men in Japan could expect to reach 79.6. Norway is still among the 8 to 10 countries in the world with the lowest death rate. However, Norwegian women can expect to live slightly shorter than women in the rest of the Nordic region, apart from Danish women who live about 2 years less than women in Norway. Norwegian men live about 2 years longer than men in Denmark and Finland, but slightly shorter than Icelandic and Swedish men. In the EU, women in Romania and men in Lithuania had the lowest life expectancy.
Relatively few are dying
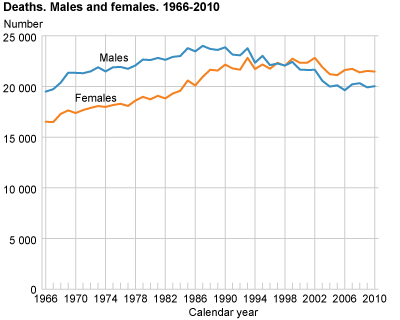
In 2010, 41 500 persons died; 21 500 women and 20 000men. The number of deaths is influenced by the population growth, age cohorts and life expectancy and we must go back to the 1970s to find a lower number of deaths. Since the end of the 1990s there has been an increasing majority of women dying, due to the fact that there are now more women in the higher age groups. The summary deaths rate, i.e. the number of deaths per 1 000 of the mean population, has never been lower. In 2010 the rate was 8.5 for both sexes; 8.2 for men and 8.8 for women. From the 1970s until 1999 the death rate was about 10 for both sexes.
Low infant mortality for boys
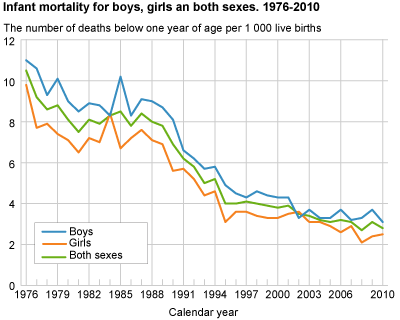
The infant mortality rate for boys was 3.1 and for girls 2.5 per 1 000 live births in 2010. This is the lowest infant mortality for boys ever registered in Norway. For both sexes in total, the rate was 2.8; 0.3 lower than the year before. There may, however, be some coincidences from one year to another. In 2010, 171 children below 1 year of age died, 97 boys and 74 girls. These are the lowest numbers ever.
Tables:
- Table 1 Deaths and death rates 1961-2010
- Table 2 Age-specific death rates for males and females. 1971-2010
- Table 3 Life expectancy - remaining years for males and females at selected ages. 1866-2010
- Table 4 Perinatal and infant mortality. 1956-2010
- Table 5 Life tables, 2010
- Table 6 Life expectancy - remaining years for males and females at selected ages, by county. 1971-2010
Contact
-
Anders Sønstebø
E-mail: anders.sonstebo@ssb.no
tel.: (+47) 46 66 37 74
-
Magnus Haug
E-mail: magnus.haug@ssb.no
tel.: (+47) 40 81 14 91
-
Ane Margrete Tømmerås
E-mail: ane.tommeras@ssb.no
tel.: (+47) 91 99 29 62
-
Statistics Norway's Information Centre
E-mail: informasjon@ssb.no
tel.: (+47) 21 09 46 42
-
Oppdrag befolkningsstatistikk
E-mail: befolkning@ssb.no


