Content
Published:
This is an archived release.
Stable internal migration pattern
In 2004 there were registered 190 500 movements between to municipalities in Norway, and this is almost 4.2 percent of the population. Net in-migration was highest around Oslo and in the larger towns in South-Norway. People in the twenties moved most frequently. There were also 392 000 movements within the municipalities. The highest proportion of the population moved within Oslo, Tromsø and Bodø.
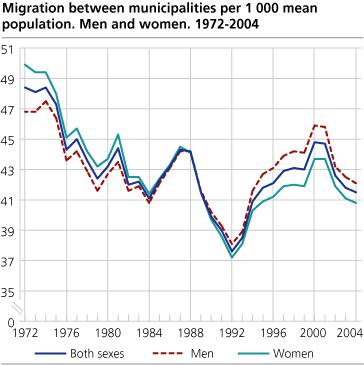
There was little change in the internal migration pattern from 2003 to 2004. The geographical mobility, migration measured in relation to the population, is still low with 4.15 per cent. The mobility was slightly higher for men than for women. The low mobility should be seen in connection to the economical situation in the country. Since 1964 it is only from 1990-1994 that the mobility has been mentionable lower than now. The number of movements was higher in 2004 than in most of the past 35 years, but this is due to a steadily increasing population.
High in-migration to Oslo among people aged 20-29 years
People in the twenties move more frequently than others. Oslo had a total gain of internal migration of 2 300 in 2004. There was only a net in-migration for the age groups 20-29 years and 16-19 years, but for these groups it was very high, with 6 400 and 700 respectively. Except from Oslo, only the counties Sør-Trøndelag, Hordaland and Rogaland had a net in-migration of people aged 20-29 years. Akershus had a net in-migration for the age groups 30-39 years and 0-5 years with 1 600 and 900 respectively. This implies that many of the people in these age groups who move from Oslo, move across the border to Akershus.
Increase in net out-migration from Møre and Romsdal
The counties Rogaland, Hordaland and those in South-East Norway, except Buskerud, had an internal net in-migration in 2004. All other counties had a smaller or lager net out-migration. The net in-migration was highest to Oslo (2 300), Akershus (1 600) and Østfold (1 100). These counties also had the highest net in-migration when we take the population size into account with 0.45, 0.35 and 0.40 per cent respectively. In Oslo, an internal net-migration of 2 300 is the highest since 1996. Net out-migration was highest from Møre og Romsdal (1 400) and Nordland (1 300). The net out-migration from Møre og Romsdal had not been so high in any year for the past thirty years. Net out-migration from Finnmark was much lower in 2004 than the past years. We need to go back to the beginning of the 1990s to fins a higher net out-migration from the county. Despite a lower net out-migration in 2004, Finnmark still showed the highest net out-migration regards to the population with 0.80 per cent, followed by Sogn og Fjordane (0.70 per cent), Møre og Romsdak (0.60 per cent) and Nordland (0.55 per cent).
The regional migration pattern was similar to that of 2003. We find the largest net in-migration regards to the population in the larger towns and in the municipalities close to these. Most of the municipalities in Northern Norway, Western Norway north of Bergen and the in the inland in South Norway showed a net out-migration.
Immigration compensates for internal migration loss
Seven of the country's counties had a net in-migration from the rest of the country, while all had a net immigration from abroad. When all types of migrations are taken into consideration, 13 counties showed a positive net migration. Only the three northern most counties, Sogn og Fjordane, Møre og Romsdal and Oppland had in total a lager migration from the county than to it. In total, Oslo and Akershus had the highest net migration with 3 800 and 3 000 respectively, followed by Rogaland (1 800) and Østfold (1 800). Møre og Romsdal had the largest migration loss with 700.
Also see the statistics about Immigration and emigration .
The statistics can also to be found in StatBank where the users may produce their own tables.
Tables:
- Table 1 All migrations. Internal and immigration/emigration, by county. 1966-2004 (corrected 08.06.2005)
- Table 2 Migration within and between counties and between counties and foreign countries. 2004
- Table 3 Internal migration, immigration and emigration, by sex, age of migrants and county. 2004
- Table 4 Internal migration. 1951-2004
- Table 5 Internal migration. County. 1966-2004 (corrected 08.06.2005)
- Table 6 Net migration between counties. 2004
- Table 7 Migration within and between regions. 2004
- Table 8 Net migration between regions. 2004
- Table 9 Internal migration, by sex and age of migrants, and age-specific rates for males and females. 2004
- Table 10 Internal migration, by sex, marital status and 5-year age groups. 2004
- Table 11 Internal migration by sex, age of migrants and county. 2004
- Table 12 Migration to/from municipalities and counties. 2004
- Table 13 Internal migration. In-migration, out-migration and net migration. Economic region. 2004
- Table 14 Migration within municipalities. 2004
- Table 15 Internal migration. Net migration, by centrality of municipalities. Migration between municipalities with the same centrality are included.The whole country. 1996-2004
Contact
-
Statistics Norway's Information Centre
E-mail: informasjon@ssb.no
tel.: (+47) 21 09 46 42
-
Oppdrag befolkningsstatistikk
E-mail: befolkning@ssb.no
-
Even Høydahl
E-mail: even.hoydahl@ssb.no
tel.: (+47) 95 77 79 06


