Content
Published:
This is an archived release.
Small increase in the mobility
In 2005, 193 600 movements were registered between two municipalities in Norway, an increase of 3 100 from last year. The counties around the Oslo fjord had the largest migration gain. In addition, 390 000 movements were registered within the country's municipalities
43 per cent of those who changed their municipality of residence in 2005, moved to another municipality in the same county, while 57 per cent moved to a different county. In total, 111 000 movements were registered between two counties, responding to 2.4 per cent of the population. 75 400 of these movements where between two regions.
4.3 per cent of the men and 4.1 per cent of the women moved. The mobility was higher than in 2003 and 2004, but less than the rest of last ten years.
Some people move more than once during a year, while others do not report that they move. Due to this, the number of registered movements is not necessary identical with the actual number of people moving.
Still migration loss for Western-Norway and Northern-Norway...
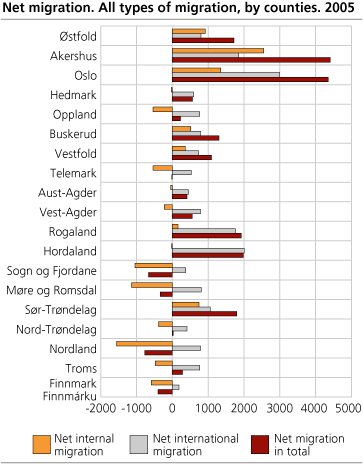
Like previous years, the counties in Northwestern-Norway and Northern-Norway had the largest internal net out-migration in 2005. In absolute figures, Nordland had the largest net out-migration with 1 550. In proportion to the population, net out-migration has in many years been highest in Finmark. In 2005 Sogn og Fjordane had the highest net out-migration with 0.98 per cent, followed by Finmark (0.81 per cent) and Nordland (0.66 per cent). Sogn and Fjordane had a migration loss to all other counties. In total, twelve counties had larger internal out-migration than in-migration.
Immigration from abroad compensates for the internal migration loss to all counties. When immigration is taken into consideration, only five counties had larger out-migration than in-migration: Nordland (-750), Sogn og Fjordane (-650), Finmark (-400), Møre og Romsdal (-340) and Telemark (-10).
...and net migration gain to Sør-Trøndelag and the counties around the Oslo fjord
In absolute figures, Akershus and Oslo had the largest internal net in-migration in 2005 with 2 550 and 1 350 respectively. Oslo and the other counties around the Oslo fjord had a larger in-migration than out-migration. Also Sør-Trøndelag had a large net in-migration with 750. In proportion to the population, net in-migration was highest in Akershus (0.51 per cent), Østfold (0.36 per cent) and Sør-Trøndelag (0.27 per cent).
When immigration is taken into account, the total net in-migration was highest in Akershus and Oslo (both 4 400 each), Hordaland (2 000) and Rogaland (1 900).
Highest proportion moved within Rogaland and Vestfold
Rogaland and Vestfold had the highest proportion of the population moving from one municipality to another within the county with 2.8 and 2.6 per cent respectively. Lowest proportion moved within Sogn og Fjordane with 1.2 per cent and Nord-Trøndelag with 1.4 per cent. The average for all counties was 2.0 per cent. Since Oslo county is only one municipality, Oslo is kept out of these calculations.
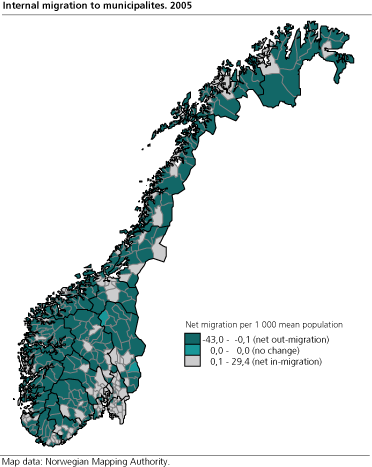
68 per cent of the municipalities had higher out-migration than in-migration
The municipalities with the largest net out-migration regards to the population were mostly smaller municipalities in the district areas. 296 of the country's 433 municipalities had a larger out-migration than in-migration.
The municipalities with the highest net in-migration are mainly located around the Oslo fjord, but also several municipalities close to Bergen had a relatively large net in-migration.
Most people move within the largest municipalities
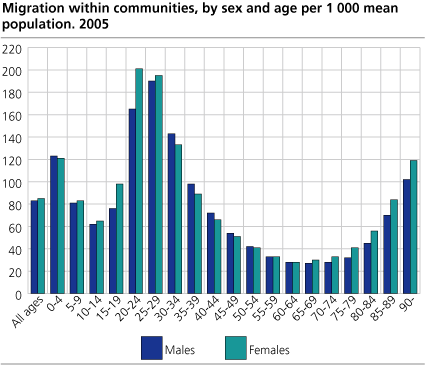
In 2005, 390 000 persons moved within the municipalities, which responds to 8.5 per cent of the women and 8.3 per cent of the men. In general terms, most people move within the larger municipalities, due to more options. Regard to the population, most people moved within Oslo (13.5 per cent), Tromsø (12.3 per cent) and Kristiansand (11.9 per cent).
People in the twenties move most frequently
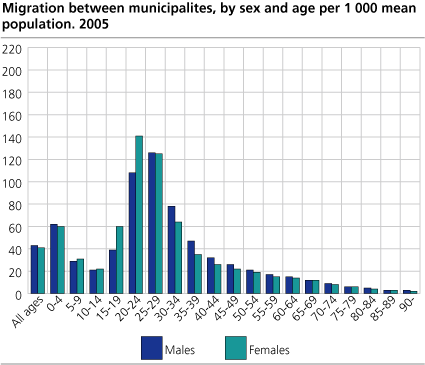
People in the twenties move most frequently, despite the length of the movement. Women aged 20-24 years move more frequently than men in the same age group, while there is little difference between the sexes in the age group 25-29 years. With the exception of movements within the municipalities, the mobility decreases after the age of 30. The mobility within the municipalities increases again at approximately the age of 70.
The mobility is higher for young women than young men partly because women are younger when they start a family. Older people move rarely to a new municipality because the already have established themselves, socially as well as economically. Few elderly get divorces or establish a new family, few elderly change their job and most of them already have the house they want. That many people move within the municipality after they have turned 70 years, is mainly because many want or need a smaller apartment or they move to a house for old people. Women live longer than men, and women are therefore more often alone when they get old. More people move to a house for old people when they are alone, than when they are two.
Also see the statistics about Immigration and emigration .
The statistics can also to be found in StatBank where the users may produce their own tables.
Tables:
- Table 1 All migrations. Internal movements and immigration1. 1966-2005
- Table 2 Migration within and between counties and between counties and foreign countries. 2005
- Table 3 Internal migration, immigration and emigration, by sex, age of migrants and county. 2005
- Table 4 Internal migration. 1951-2004
- Table 5 Internal migration, by county. 1966-2005
- Table 6 Net migration between counties. 2005
- Table 7 Migration within and between regions. 2005
- Table 8 Net migration between regions. 2005
- Table 9 Migration within municipalities, between municipalities, between counties and between regions, by the person's age and sex. Absolute figures and age-specific rates. 2005
- Table 10 Internal migration, by sex, marital status and 5-year age groups. 2005
- Table 11 Internal migration to and from the counties, by sex and age of migrant. 2005
- Table 12 Migration to/from counties and municipalities. 2005
- Table 13 Internal migration. In-migration, out-migration and net migration. Economic region. 2005
- Table 14 Migration within municipalities. 2005
- Table 15 Internal migration, by centrality of municipalities. Migration between municipalities with the same centrality are included. The whole country. 1996-2005
Contact
-
Statistics Norway's Information Centre
E-mail: informasjon@ssb.no
tel.: (+47) 21 09 46 42
-
Oppdrag befolkningsstatistikk
E-mail: befolkning@ssb.no
-
Even Høydahl
E-mail: even.hoydahl@ssb.no
tel.: (+47) 95 77 79 06


