Content
Published:
This is an archived release.
Largest increase ever in immigrant population
The total population in Norway increased by 29 000 persons from 1 January 2006 to 1 January 2007, the largest annual increase ever. They are 415 300 persons in Norway with immigrant background, or 8.3 per cent of the total population.
At the beginning of 2007 there were 341 800 first-generation immigrants in Norway and 73 500 persons born in Norway with to two foreign-born parents.
|
Immigrant population includes persons who have two foreign-born parents, or more precisely: Persons who neither have parents nor grandparents born in Norway. The immigrant population thus covers first-generation immigrants and persons born in Norway of two foreign-born parents. |
High increase in immigrant population from Poland
There has been the largest increase in the numbers of people with Polish immigrant background, with 7 000 persons, followed by Germans (1 600), Somalis (1 500) and Swedes (1 100). The Polish immigrant population has showed a large increase over the last two years (8 900 persons), and now it is the sixth largest immigrant group in Norway.
The population growth among people with immigrant background from eastern Europe was 11 400 persons, while immigrant population from Asia and Africa increased by 12 000 persons.
Persons with non-western background dominate
The increase in immigrant population is mostly a result of immigration from non-western countries.
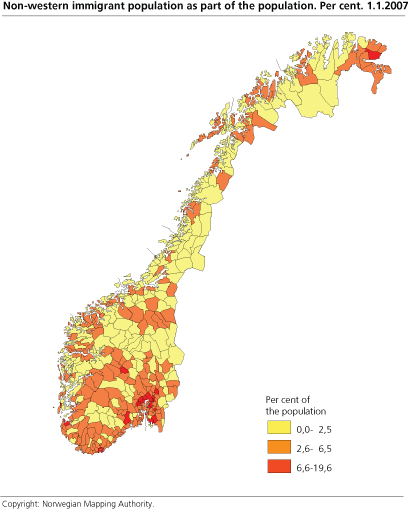
Three out of four persons in immigrant population have a non-western background, or 6.6 per cent of the total population. At the beginning of 1986, the non-western immigrant population made up 1.1 per cent of the total population.
Even gender distribution
On 1 January 2007, the immigrant population consisted of nearly as many men as women (208 500 women and 206 800 men). Nevertheless, there were considerable differences depending on country background. A larger surplus of men was found among immigrants from Poland, Great Britain and Iraq with 60, 59 and 57 per cent respectively. Among immigrants from Thailand, the Philippines and Russia there was a surplus of women (84, 77 and 66 per cent respectively).
Geographical distribution of immigrant population in Norway
There were immigrants resident in all the Norwegian municipalities. 31.5 per cent of the immigrant population lived in Oslo at the beginning of 2007.
Oslo had the highest proportion of non-western immigrants with 20 per cent, followed by Drammen (16 per cent) and Lørenskog (13 per cent). Just two municipalities in Norway, Beiarn and Osen, didn't have any residents with non-western background on 1 January 2007.
Tables:
- Table 1 Population 1st January 2006 and 2007 and changes in 2006, by immigrant category and country background
- Table 2 Five different delimitations of persons with immigration background/foreign background, by citizenship and immigrant category. 1 January 2007
-
Table 3 Three categories of immigration background , country of birth and citizenship, by country background and sex.
1st January 2007 - Table 4 Three variants of immigration background, country of birth and citizenship, 1st january 2007
-
Table 5 Immigrant population and persons with other immigrant background , by country background and sex.
1st January 2007 -
Table 6 Immigrant population and persons with other immigration background by sexs, age and country background.
1st January 2007. Absolute figures and per cent - Table 7 Population and the immigrant population by country background. 1970-2007. Absolute figures and per cent
- Table 8 Population by Norwegian/foreign citizenship and immigrant populations country background1. 1st January 2007
- Table 9 Immigrant population, by country background. County. 1st January 2007
- Table 10 Immigrant population, by country background and municipality. 1st January 2007. Absolute figures and per cent
- Table 11 Immigrant population by country of birth, (the 20 largest groups). Selected municipalities. 1st January 2007
-
Table 12 Immigrant population by five groups of country background. Urban districts of Oslo. 1st January 2007.
Absolute figures and per cent - Table 13 Immigrant population by two groups of country background and age . Urban districts of Oslo. 1st January 2007
- Table 14 First generation immigrants, by lenght of stay/first immigrations year and country background. 1st January 2007
Additional information
Contact
-
Oppdrag innvandring
E-mail: oppdraginnvandring@ssb.no
-
Alice Steinkellner
E-mail: alice.steinkellner@ssb.no
tel.: (+47) 90 72 90 51
-
Statistics Norway's Information Centre
E-mail: informasjon@ssb.no
tel.: (+47) 21 09 46 42


