Content
Published:
This is an archived release.
Turnover of NOK 351 billion
From 2007 to 2008, turnover in the local kind-of-activity units in the construction industry increased by NOK 23 billion, or 6.9 per cent.
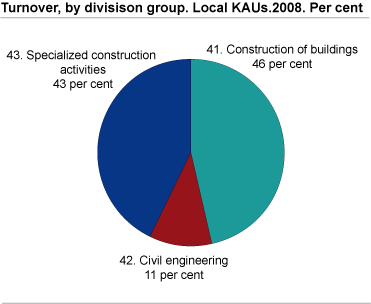
The construction industry is divided into several divisions. The largest division is construction of buildings. The local KAUs within this division had a total turnover of NOK 163.7 billion and employed 67 527 persons in 2008. This is an increase of 1.4 per cent and 11.1 per cent respectively.
This division accounted for 46.7 per cent of the total turnover in construction.
Largest employment within specialised construction activities
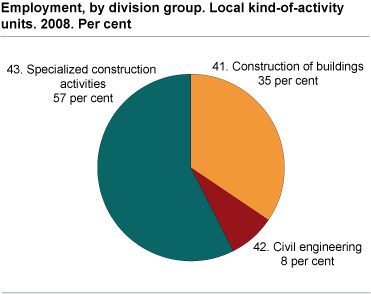
The local KAUs within specialised construction activities mostly employ persons within the construction industry, with 112 203 persons in 2008; an increase of 11.1 per cent compared to 2007.
This is equal to approximately 57 per cent of the total employment in the construction industry.
The largest local KAUs have the majority of the turnover
The number of local KAUs with 20 or more persons employed accounted for approximately 4 per cent of the total number within the construction industry in 2008. They had a turnover of NOK 113 billion in 2008, or 52 per cent of the total turnover within the construction industry. They employed 90 829 persons, which is equal to approximately 47 per cent of the total employment in the construction industry.
Statistics at enterprise levelThe structural business statistics for construction are compiled both at local KAU level and enterprise level. The figures at enterprise level may differ from figures at local KAU level. This is due to some enterprises being registered in one industry group according to main activity, while at the same time consisting of local KAUs in other groups. At enterprise level, the turnover increased by 7.1 per cent to NOK 351.9 billion. For more information and definitions, go to About the statistics. |
Revision of industriesSince January 2009, a new Standard Industrial Classification (SIC 2007) has been in use. The structural business statistics 2008 are published in line with both the new and the old classification. In addition, the figures for 2007 are also published according to the new standard. Building project developments (housing cooperatives and the development and sale of property) have been included in the building and construction activity. Industries were also broken down in order to make a clearer distinction between the building activity and construction activity. For general information about the transition to the new Standard Industrial Classification click here . |
Tables:
- Table 1 Principal figures, by industry subclass. Local kind-of-activity units. 2007 and 2008
- Table 2 Principal figures, by number of persons employed and industry group. Local kind-of-activity units. 2008
- Table 3 Principal figures for the industrial section, by county. 2008
- Table 4 Principal figures, by industry subclass. Enterprises. 2007 and 2008
- Table 5 Principal figures, by number of persons employed and industry group. Entreprises. 2008
The statistics is now published as Business statistics.
Additional information
Contact
-
Statistics Norway's Information Centre
E-mail: informasjon@ssb.no
tel.: (+47) 21 09 46 42


