Growth is flattening out
Published:
Enterprises in the manufacturing, mining and quarrying industries showed littles changes in key economic variables such as turnover, employment and in the number of enterprises in 2015. A closer look at the different industries reveals that some have continued their positive trend from previous years, while the oil-related industries have had a tougher year.
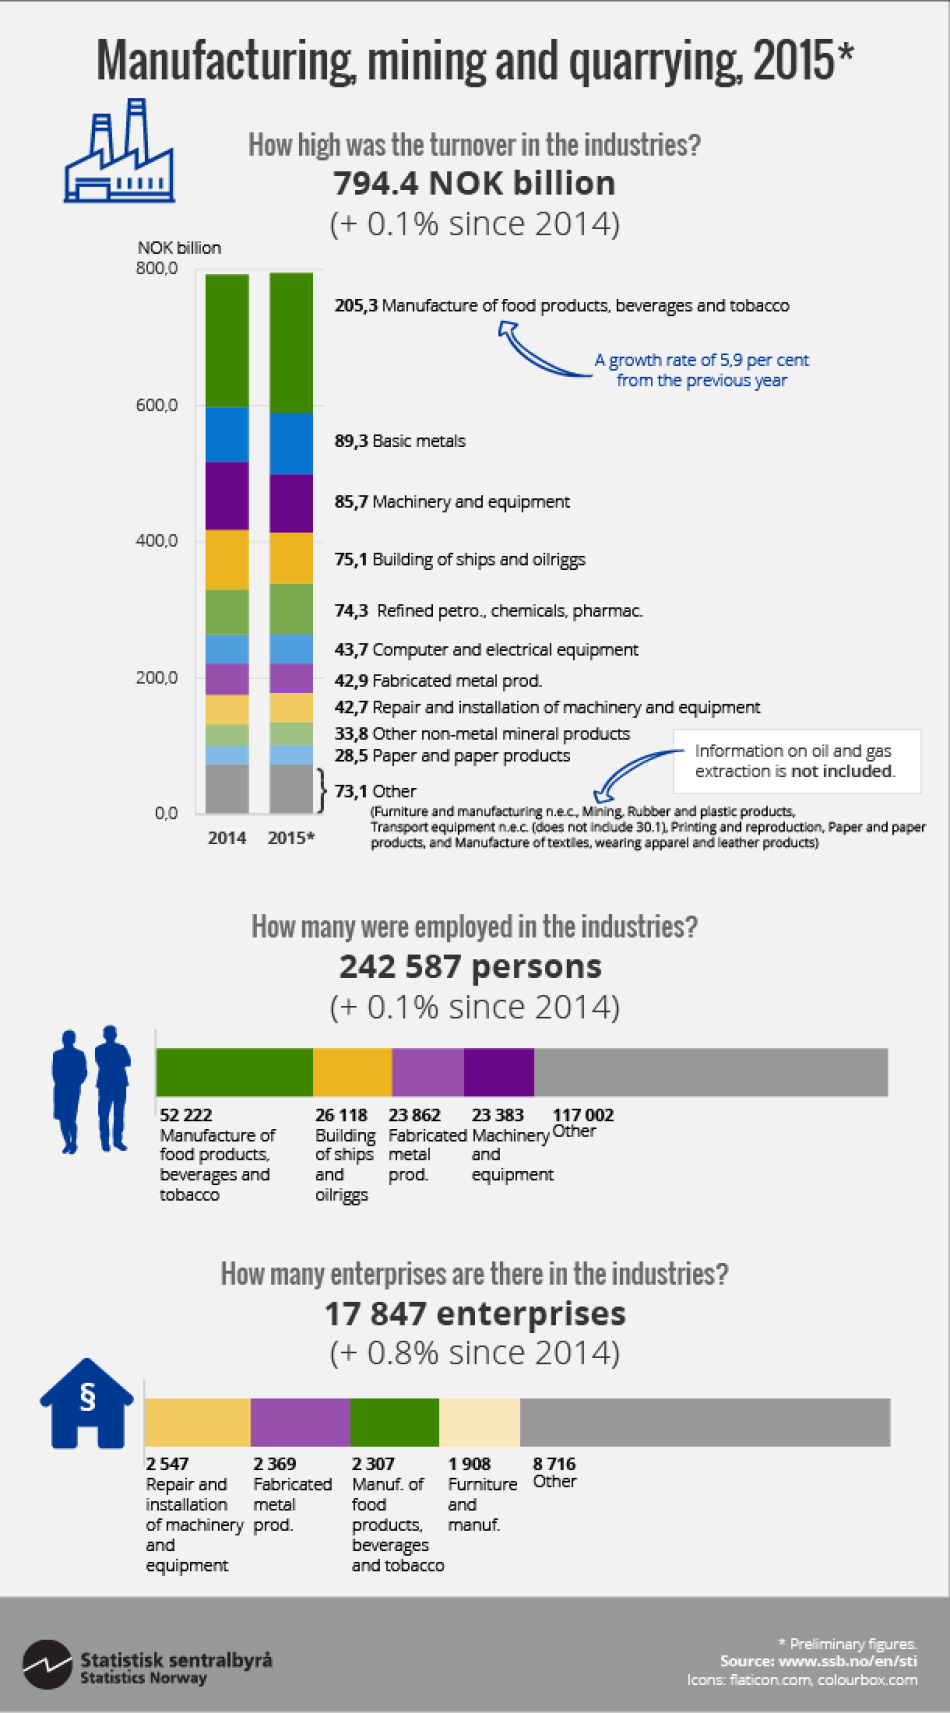
The total turnover for enterprises in the manufacturing, mining and quarrying industries was NOK 794 billion in 2015. This is about the same level as in 2014. The food, drink and tobacco industry continued its positive trend from previous years. A turnover of NOK 205 billion in 2015 amounted to a growth rate of 5.9 per cent from the previous year. This is largely driven by the food industry. The seafood industry alone makes up about 40 per cent of the total growth.
The basic metal industry also experienced a growth in 2015. A turnover of NOK 89 billion in 2015 amounted to a growth of 11 per cent from 2014. This can largely be explained by an increase in the price of metals. The largest part of the growth in turnover stemmed from the production of basic precious and non-ferrous metals, which makes up 86.4 per cent of the basic metal industry, and increased turnover by 13.1 per cent from 2014.
On the other side of the growth scale we find the oil-related industries. Both machinery and equipment industries, and enterprises building ships, boats and oil platforms, have experienced a strong negative growth in turnover. This can largely be explained by the fall in prices of oil and gas, which in turn has led to a fall in investments for these enterprises.
No change in employment
The change in employment largely follows that of the turnover. Employment increased in enterprises in the manufacturing, mining and quarrying industries by 0.1 per cent, while the food and metal industries saw an increase of 3.2 and 4.5 per cent respectively. Enterprises in building ships, boats and oil platforms saw a drop in employment of 6.7 per cent.

Contact
-
Per Hellem
-
Øyvind Bruer-Skarsbø
-
Statistics Norway's Information Centre
