Content
Published:
This is an archived release.
Slight decline in manufacturing
Turnover in Norwegian manufacturing was approximately NOK 44 billion in November 2003. One month before the end of the year, manufacturing had a total turnover of NOK 465 billion. This is a 2.2 per cent decline compared with the January-to-November-figure for 2002.
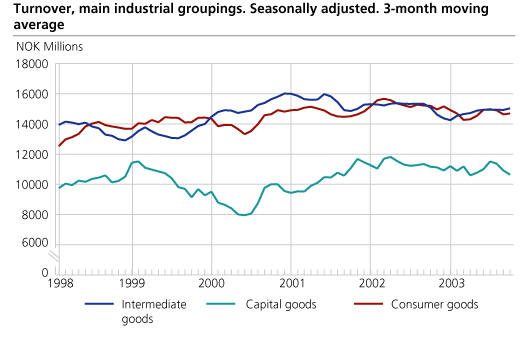
Among the main industrial groupings, capital goods experienced the most distinct change in turnover in the September-to-November-period, declining 7.6 per cent from the previous three-month period. The strongest contributor to the decline was lower turnover within transport equipment. Turnover within this industry was noticeably lower in the period compared with the preceding three-month-periods.
Intermediate goods up 0.6 per cent
There was little change in turnover for intermediate goods in the September-to-November-period compared with the previous three-month-period. However, the two large industries within intermediate goods, non-ferrous metals and basic chemicals, both experienced increases of 11.5 per cent in the period.
Consumer goods down 1.9 per cent
Consumer goods had a slight fall compared with the previous three-month period. This is a result of a decline within food and food products. The decrease was subdued by improved turnover within publishing, printing and reproduction.
Oil- and gas extraction up 6 per cent
Turnover within Norwegian oil- and gas extraction was approximately NOK 30 billion in November 2003, according to unadjusted figures. Turnover in the three-month period from September to November was 6 per cent higher than turnover in the previous three-month period. The raise is a result of increases in both production and price.
|
Statistics on turnover of oil and gas extraction, mining and quarrying, manufacturing, electricity and gas supply.
November 2003 |
|
Original series
November 2003 |
Changes in per cent
November 2002- November 2003 |
Original series1 January-November 2003 |
Changes in per cent
January-November 2002- January-November 2003 |
Seasonally adjusted changes
in per cent October 2003- November 2003 |
|||||||||||||||||||||||||||||||||||
|---|---|---|---|---|---|---|---|---|---|---|---|---|---|---|---|---|---|---|---|---|---|---|---|---|---|---|---|---|---|---|---|---|---|---|---|---|---|---|---|
| The overall turnover | 84 052 | -2.5 | 902 542 | 3.1 | 1.1 | ||||||||||||||||||||||||||||||||||
| Oil and Gas Extraction | 30 055 | 2.9 | 319 069 | 0.8 | 7.5 | ||||||||||||||||||||||||||||||||||
| Manufacturing | 43 615 | -2.1 | 465 110 | -2.2 | -1.1 | ||||||||||||||||||||||||||||||||||
| Electricity, Gas and Steam Supply | 9 831 | -14.6 | 112 475 | 49.1 | -10.2 | ||||||||||||||||||||||||||||||||||
| Main industrial groupings | |||||||||||||||||||||||||||||||||||||||
| Intermediate goods | 15 472 | -1.6 | 164 160 | -3.1 | -0.4 | ||||||||||||||||||||||||||||||||||
| Capital goods | 10 827 | -4.6 | 117 140 | -3.6 | -1.7 | ||||||||||||||||||||||||||||||||||
| Consumer goods | 15 432 | -4.9 | 162 078 | -4.4 | 0.1 | ||||||||||||||||||||||||||||||||||
| Energy goods | 42 321 | -1.4 | 459 162 | 10.6 | 3.6 | ||||||||||||||||||||||||||||||||||
| 1 | NOK million. |
Find more figures
Find detailed figures from Turnover in oil and gas, manufacturing, mining and electricity supply
Additional information
The variation in manufacturing turnover can be related to changes in volume and price indices in different industries and also production to stocks and sales from stocks.
Contact
-
Robert Skotvold
E-mail: robert.skotvold@ssb.no
tel.: (+47) 40 90 24 44
-
Anne Karin Linderud Haugen
E-mail: anne.karin.linderud.haugen@ssb.no
tel.: (+47) 91 88 19 76

