Content
Published:
This is an archived release.
Turnover still high in manufacturing
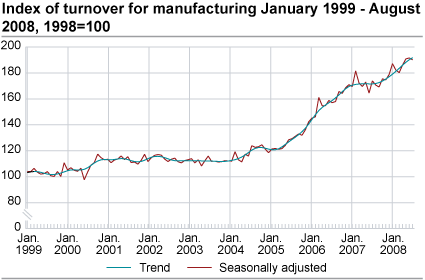
Total turnover in Norwegian manufacturing was 4.3 per cent higher in June to August 2008 than in the previous three-month period, according to seasonally adjusted figures. The turnover of capital goods increased the most.
Total turnover rose by 5.8 percent in the domestic market and by 4.7 percent in the export market. The growth in total turnover is in part a result of price developments between the two periods March to May 2008 and June to August this year (see Producer price index ).
Largest increase in turnover of capital goods
Seasonally adjusted figures show that the turnover of capital goods increased by 7.8 per cent from June to August this year compared with the previous three-month period. Turnover in the domestic market rose by 18.9 per cent, while turnover in the export market declined by 10.4 per cent. Machinery and equipment and transport equipment were the main contributors to increased turnover of capital goods.
Intermediate goods turnover went up by 2.5 per cent. Turnover in the domestic market increased by 2.2 per cent, while export turnover rose by 3.5 per cent. Refined petroleum products, chemicals and chemical products and basic chemicals had the largest increase in turnover. These groups of products have experienced price rise during the last three months, even though refined petroleum products, chemicals and chemical products had a price decline in August.
Consumer goods turnover grew by 0.8 per cent. Domestic turnover rose by 1.1 per cent, while export turnover dropped by 0.6 per cent. Food products contributed the most to the growth in consumer goods turnover.
Turnover decrease from July to August
Total turnover dropped by 0.7 per cent from July to August this year. The increase in turnover for the last three-month period is due to high turnover figures in June and July.
Growth since August 2007
Unadjusted figures show that total turnover rose by 4.5 per cent from august 2007 to august 2008. Capital goods experienced the largest increase with 11.2 per cent growth in turnover. Intermediate goods turnover went up by 3.9 per cent, while consumer goods turnover declined by 5.5 per cent.
|
Original series.1 January-August 2008 |
Changes in per cent.
January-August 2007- January-August 2008 |
Original series.1 August 2008 |
Changes in per cent.
August 2007- August 2008 |
Changes in per cent.
Seasonally adjusted. March 2008-May 2008- June 2008-August 2008 |
|||||||||||||||||||||||||||||||||||
|---|---|---|---|---|---|---|---|---|---|---|---|---|---|---|---|---|---|---|---|---|---|---|---|---|---|---|---|---|---|---|---|---|---|---|---|---|---|---|---|
| The overall turnover | 1 096 932 | 17.6 | 139 872 | 17.6 | 6.5 | ||||||||||||||||||||||||||||||||||
| Oil and Gas Extraction | 456 459 | 28.2 | 59 065 | 30.3 | 6.6 | ||||||||||||||||||||||||||||||||||
| Manufacturing | 559 983 | 8.0 | 70 176 | 4.5 | 4.3 | ||||||||||||||||||||||||||||||||||
| Hjemmemarked | 337 817 | 8.0 | 44 429 | 3.8 | 5.8 | ||||||||||||||||||||||||||||||||||
| Eksportmarked | 222 166 | 8.0 | 25 747 | 5.8 | 4.7 | ||||||||||||||||||||||||||||||||||
| Electricity, Gas and Steam Supply | 71 357 | 41.2 | 8 858 | 71.1 | 18.6 | ||||||||||||||||||||||||||||||||||
| Main industrial groupings | |||||||||||||||||||||||||||||||||||||||
| Intermediate goods | 205 187 | 3.0 | 26 780 | 3.9 | 2.5 | ||||||||||||||||||||||||||||||||||
| Capital goods | 168 582 | 14.4 | 20 839 | 11.2 | 7.8 | ||||||||||||||||||||||||||||||||||
| Consumer goods | 131 557 | 0.8 | 16 182 | -5.5 | 0.8 | ||||||||||||||||||||||||||||||||||
| Energy goods | 591 609 | 29.9 | 76 071 | 32.8 | 7.6 | ||||||||||||||||||||||||||||||||||
| 1 | NOK million. |
Find more figures
Find detailed figures from Turnover in oil and gas, manufacturing, mining and electricity supply
Additional information
The variation in manufacturing turnover can be related to changes in volume and price indices in different industries and also production to stocks and sales from stocks.
Contact
-
Robert Skotvold
E-mail: robert.skotvold@ssb.no
tel.: (+47) 40 90 24 44
-
Anne Karin Linderud Haugen
E-mail: anne.karin.linderud.haugen@ssb.no
tel.: (+47) 91 88 19 76

