Content
Published:
This is an archived release.
Growth in industrial turnover
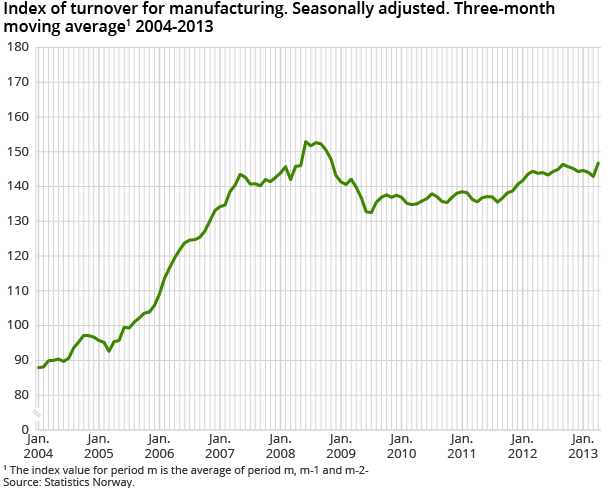
Seasonally-adjusted figures showed that the total turnover in Norwegian manufacturing increased by 1.5 per cent from February to April 2013 compared to the previous three-month period.
| Seasonally adjusted | Unadjusted | |||
|---|---|---|---|---|
| Monthly change | Three-month change | Twelve-month change | NOK million | |
| April 2013 / March 2013 | February 2013 - April 2013 / November 2012 - January 2013 | April 2013 / April 2012 | April 2013 | |
| Extraction, mining, manufacturing and elec | 3.8 | 0.2 | 5.5 | 138 171 |
| Extraction and related services | 0.2 | -1.8 | -9.2 | 55 783 |
| Mining and quarrying | -3.6 | -0.8 | -19.8 | 956 |
| Manufacturing | 10.4 | 1.5 | 14.9 | 68 162 |
| Food, beverages and tobacco | 5.3 | 0.1 | 18.4 | 15 403 |
| Refined petro., chemicals, pharmac. | -1.2 | 1.4 | -3.3 | 11 830 |
| Basic metals | 4.4 | -1.4 | -3.5 | 4 592 |
| Machinery and equipment | 42.9 | 1.5 | 41.9 | 7 362 |
| Ships, boats and oil plattforms | 0.9 | -7.5 | 9.7 | 4 955 |
| Electricity, gas and steam | 25.9 | 8.9 | 47.5 | 13 269 |
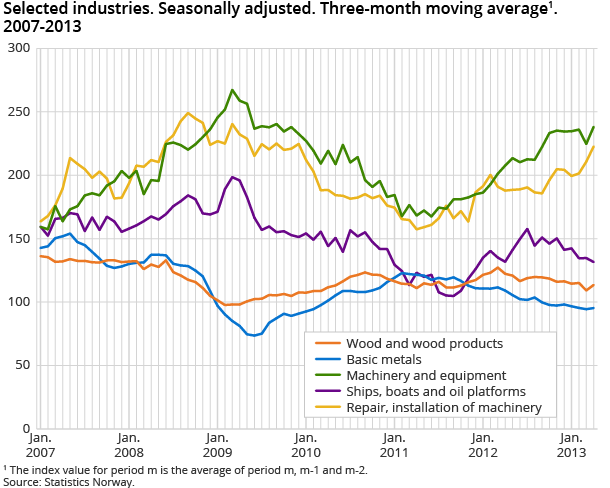
The majority of industries have shown an increase in turnover in the last three-month period according to seasonally-adjusted figures. Deliveries of several projects within repair and installation of machinery contributed to an increase in turnover of 11.7 per cent. The industrial production index shows a big increase in volume. At the same time, fabricated metal products showed a higher turnover of 8.6 per cent.
Industries with reduced industrial turnover included building of ships and oil platforms, which decreased by 7.5 per cent. In addition, basic metals fell by 1.5 per cent.
Strong figures for suppliers to the oil and gas sector
Seasonally-adjusted figures showed that total Norwegian manufacturing went up from March to April 2013. Important suppliers to the oil and gas sector are lifting up the total industrial turnover.
Machinery and equipment had a 42.9 per cent increase. Repair, and installation of machinery was up by 15.5 per cent. In addition, food products went up 5.3 per cent in this period.
Machinery and equipment growing strong from April 2012
Unadjusted figures showed an increase of 14.8 per cent in total manufacturing turnover in April 2013 compared to April 2012. The placing of Easter affects the unadjusted series and much of the increased turnover can be explained by more working days in April 2013 than April 2012. The largest increase in turnover was within machinery and equipment, growing by 42.0 per cent. This was due to both larger production volume and higher prices. Meanwhile, the industry of rapair and installation of machinery went 32.2 per cent up. The same was for fabricated metal products, wich grew by 21.8 per cent.
Conversely, turnover for basic metals was 3.5 per lower than April 2012.
Norway and the euro area
Seasonally-adjusted figures show that Norwegian manufacturing turnover went down 2.0 per cent from February to March 2013. Manufacturing turnover in the euro area went down 0.5 per cent in the same period, according to figures published by Eurostat.
On the effect of EasterOpen and readClose
It is important to be aware that the uncertainty for the calendar-adjusted and seasonally-adjusted indices for March and April is greater than normal due to the changed placing of Easter. This effect will also affect the seasonally-adjusted figures for the 1st and 2nd quarters. This is accounted for when adjusting for seasonal variations. However, it can still be difficult to adjust for all impacts.
Interpretation of seasonally-adjusted figuresOpen and readClose
In order to facilitate the interpretation of the short-term development, statistics on turnover publishes three-month moving averages of the seasonally-adjusted figures. We normally compare the latest non-overlapping three-month periods, for instance February to April 2013 compared with November 2012 to January 2013. Seasonally-adjusted monthly changes must be interpreted with caution.
Find more figures
Find detailed figures from Turnover in oil and gas, manufacturing, mining and electricity supply
Additional information
The variation in manufacturing turnover can be related to changes in volume and price indices in different industries and also production to stocks and sales from stocks.
Contact
-
Robert Skotvold
E-mail: robert.skotvold@ssb.no
tel.: (+47) 40 90 24 44
-
Anne Karin Linderud Haugen
E-mail: anne.karin.linderud.haugen@ssb.no
tel.: (+47) 91 88 19 76


