Content
Published:
This is an archived release.
Large growth in turnover
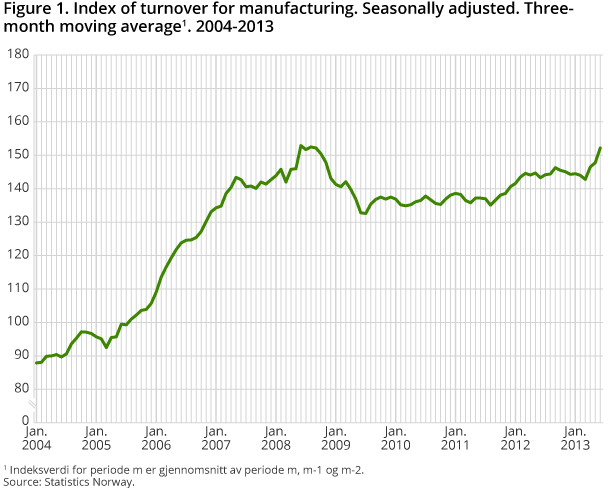
Seasonally-adjusted figures showed that the total turnover in Norwegian manufacturing increased by 6.6 per cent from the first quarter to the second quarter of 2013.
| Seasonally adjusted | Unadjusted | |||
|---|---|---|---|---|
| Monthly change | Three-month change | Twelve-month change | NOK million | |
| June 2013 / May 2013 | April 2013 - June 2013 / January 2013 - March 2013 | June 2013 / June 2012 | June 2013 | |
| Extraction, mining, manufacturing and elec | 3.2 | 5.8 | 4.8 | 137 488 |
| Extraction and related services | 3.0 | 6.2 | 1.2 | 54 126 |
| Mining and quarrying | -3.6 | 0.2 | -22.8 | 1 031 |
| Manufacturing | 4.5 | 6.6 | 4.8 | 72 356 |
| Food, beverages and tobacco | 1.1 | 6.3 | 2.8 | 15 627 |
| Refined petro., chemicals, pharmac. | -1.0 | -4.7 | 4.0 | 11 912 |
| Basic metals | 0.0 | -1.8 | -18.7 | 4 339 |
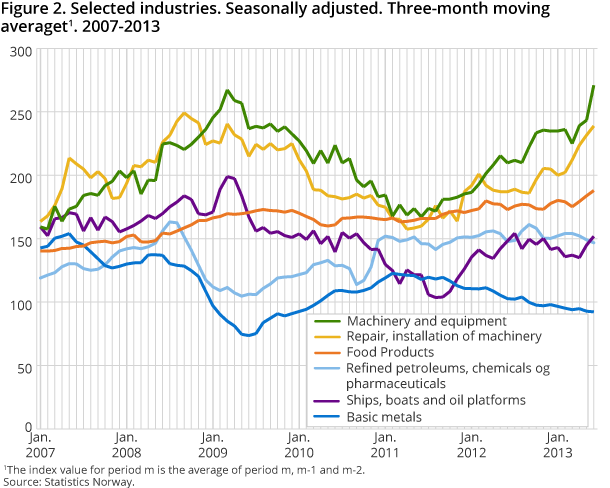
| Machinery and equipment | 17.6 | 20.4 | 38.5 | 8 076 |
| Ships, boats and oil plattforms | 3.2 | 10.8 | 12.3 | 6 513 |
| Electricity, gas and steam | 15.2 | 23.1 | 36.1 | 9 976 |
The majority of the industries within Norwegian manufacturing showed increased turnover from the first quarter to the second quarter of 2013. Within the export market, turnover fell by 0.8 per cent, while increasing 9.9 per cent within the domestic market. Turnover growth is still strongest for the industries that deliver to the oil and gas sector. Machinery and equipment showed a 20.4 per cent increase, while building of ships, boats and oil platforms went up 10.9 per cent. Within repair and installation of machinery turnover went up by 12.6 per cent. In addition, food products went up 7.2 per cent.
Conversely, industries with reduced turnover were the grouping refined petroleum, chemicals and pharmaceutical, falling by 5.9 per cent. This was due to lower prices. Basic metals also fell, by 1.9 per cent, due to lower production volume and prices.
Increase in turnover from May to June
Seasonally-adjusted figures showed that total Norwegian manufacturing turnover went up by 4.4 per cent from May to June 2013. Machinery and equipment increased by 17.6 per cent. Computer and electrical equipment also grew, by 13.6 per cent. Meanwhile, refined petroleum, chemicals and pharmaceutical went down by 1.0 per cent.
Increase from June 2011 to June 2012
Unadjusted figures showed an increase of 4.8 per cent in total manufacturing turnover in June 2013 compared to June 2012. The domestic market increased as a whole; by 9.6 per cent, while the export market declined 3.0 per cent. The largest increase in turnover was for machinery and equipment growing by 38.5 per cent. This was followed by repair and installation of machinery by 26.0 per cent. Additionally, food products reported growth in turnover from June 2012.
On the other hand, basic metals experienced a fall in turnover, with a downturn of 18.8 per cent compared to June 2012. This was mainly because of a weak development within the export market. This applies specially to non-ferrous metals.
Norway and the euro area
Seasonally-adjusted figures show that Norwegian manufacturing turnover went up 4.4 per cent from April to May 2013. Manufacturing turnover in the euro area went down 0.4 per cent in the same period, according to figures published by Eurostat.
Interpretation of seasonally-adjusted figuresOpen and readClose
In order to facilitate the interpretation of the short-term development, statistics on turnover publishes three-month moving averages of the seasonally-adjusted figures. We normally compare the latest non-overlapping three-month periods, for instance April to June 2013 compared with January to March 2013. Seasonally-adjusted monthly changes must be interpreted with caution.
On the effect of EasterOpen and readClose
It is important to be aware that the uncertainty for the calendar-adjusted and seasonally-adjusted indices for March and April is greater than normal due to the changed placing of Easter. This effect will also affect the seasonally-adjusted figures for the 1st and 2nd quarters. This is accounted for when adjusting for seasonal variations. However, it can still be difficult to adjust for all impacts.
Find more figures
Find detailed figures from Turnover in oil and gas, manufacturing, mining and electricity supply
Additional information
The variation in manufacturing turnover can be related to changes in volume and price indices in different industries and also production to stocks and sales from stocks.
Contact
-
Robert Skotvold
E-mail: robert.skotvold@ssb.no
tel.: (+47) 40 90 24 44
-
Anne Karin Linderud Haugen
E-mail: anne.karin.linderud.haugen@ssb.no
tel.: (+47) 91 88 19 76


