Content
Published:
This is an archived release.
Increasing growth in Norwegian forests
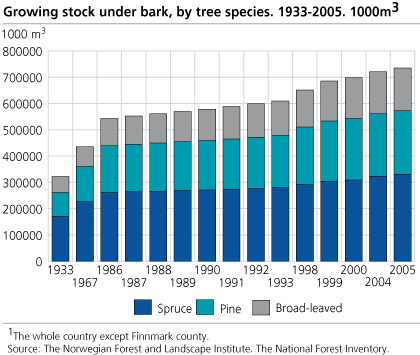
In 2005, the volume of growing stock increased by 14.8 million cubic meters. The total is now twice as large as in the 1930's.
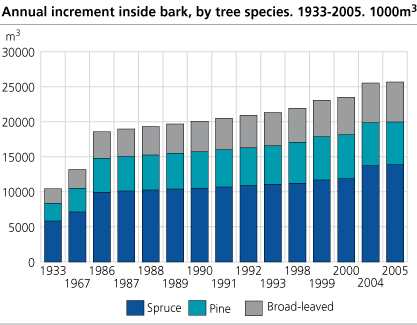
The National Forest Inventory estimates that the increment last year was 25.7 million cubic meters under bark. In comparison, 9 million cubic meters were cut for sale last year.
The spruce accounts for almost half the increment. The increment rose both for spruce and for broad-leaved forests, while pine forest decreased slightly. During the last 40 years the annual increment has become twice as large. The main reasons are systematic silviculture and regeneration for decades, and better age distribution of trees. It is also reason to believe that the increment is influenced by the climate.
Spruce accounts for half the growing stock
In total, the volume of growing stock in Norwegian forests accounted to 736 million cubic meters in 2005. Nearly half of the volume is spruce, and from the previous year, the volume of spruce increased by 8 million cubic meters. Next to spruce, the volume of growing stock increased most for the broad-leaved forests. The broad-leaved forests correspond to one fifth of the growing stock.
The distribution in age changes
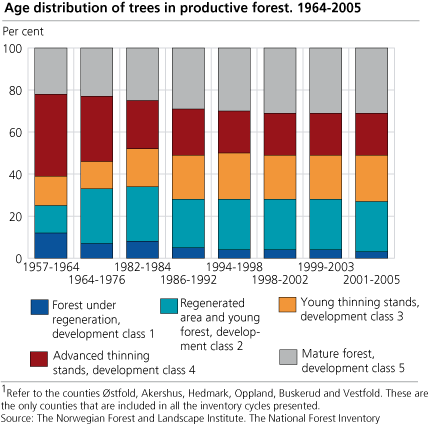
The age distribution of forests has changed. Since the first inventory, the percentage of mature forest has risen. For six of the counties in the most important forest district, the estimate shows that 31 per cent of the forest was mature in 2005. 40 years ago the corresponding figure was 22 per cent. In the same period the area of young forest and young thinning stands has increased.
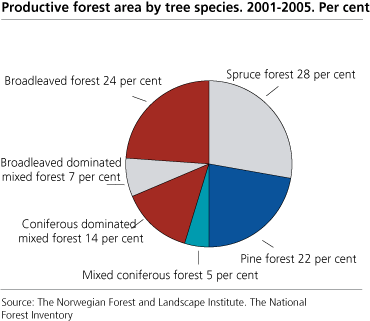
The total productive forest area below the coniferous forest line is 74 100 square kilometer. In addition, 17 100 square kilometer is considered as unproductive forest. In total, 91 200 square kilometer is wooded land. The total area of wooded land is approximately 120 000 square kilometer.
Tables
- Table 1 Growing stock inside bark and annual increment inside bark. The whole country. 1933-2005. 1 000 m 3
- Table 2 Total area, by type of vegetation and appraised regions. km 2
- Table 3 Productive forest area, by development class, site quality class and appraised regions. Per cent
- Table 4 Growing stock under bark, by type of land, species of tree and appraised regions. 1 000 m 3
- Table 5 Annual increment under bark, by type of land, species of tree and appraised regions. 1 000 m 3
Contact
-
Trond Amund Steinset
E-mail: trond.amund.steinset@ssb.no
tel.: (+47) 40 81 13 73


